
Market Sentiment Analysis in Crypto: A Practical Guide
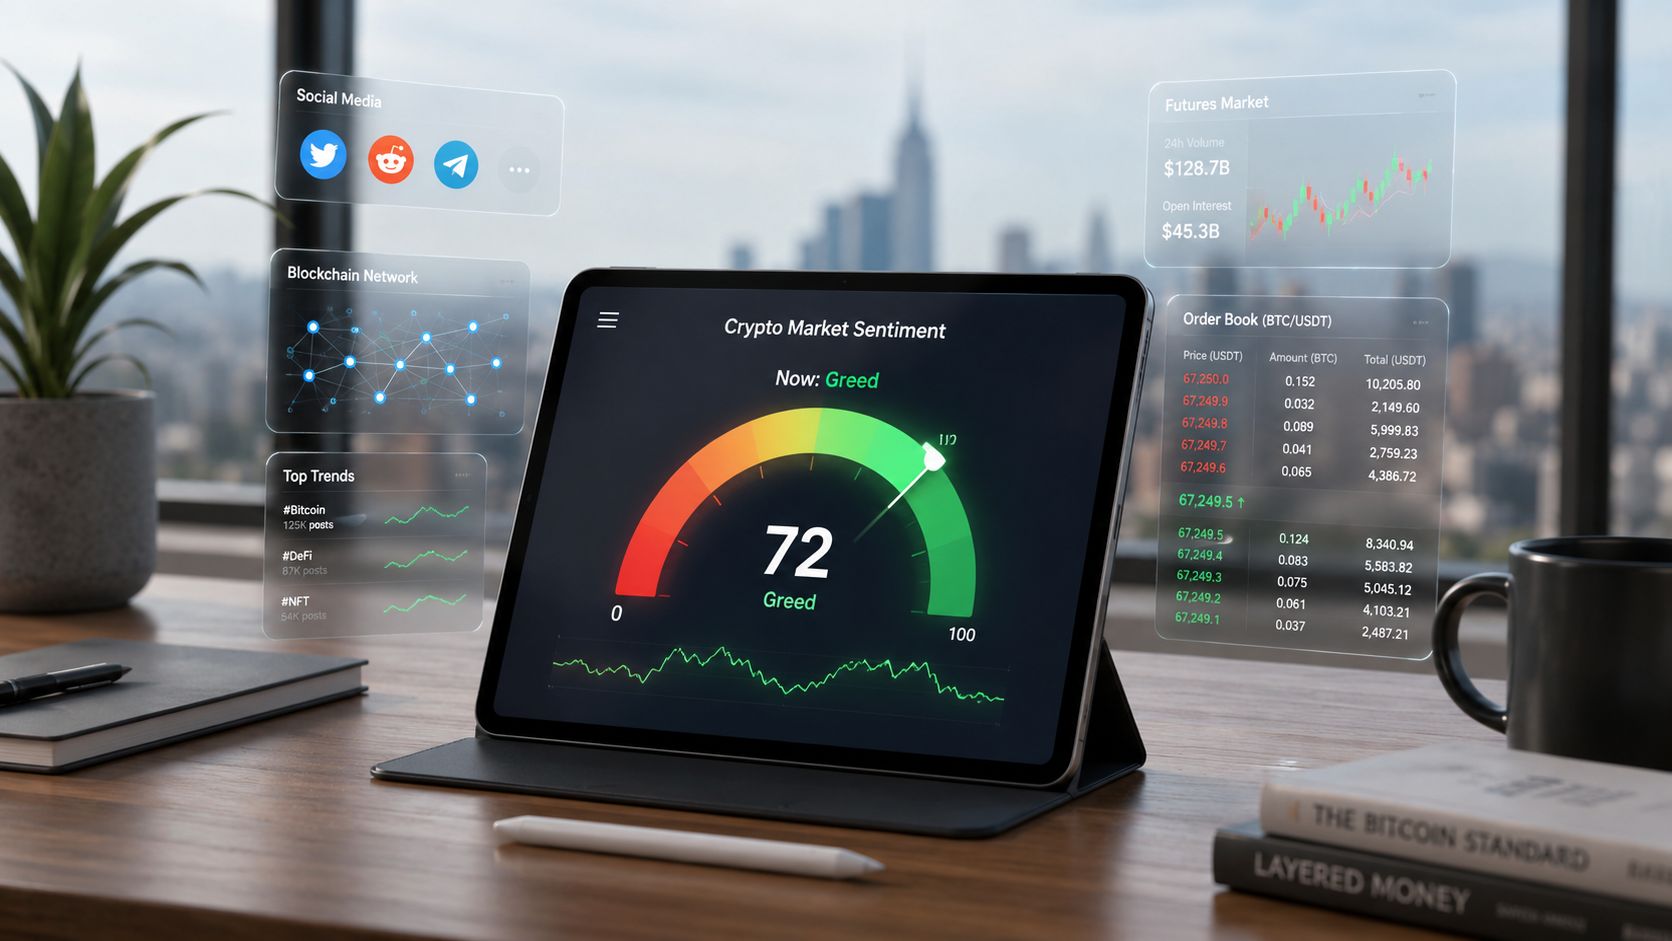
You check your phone after a sharp Bitcoin drop and find two completely different markets competing for your attention. One timeline says the dip is an obvious opportunity. Another says the cycle has topped. A Telegram group is celebrating a whale transfer, while derivatives traders are watching liquidations and reducing risk. The chart shows what price did, but it doesn't explain which mood is driving the next decision.
That gap is where market sentiment analysis helps. Used properly, it turns social chatter, on-chain activity, derivatives positioning, and order-flow behavior into context you can test against price and fundamentals. It won't tell you exactly what Bitcoin, Ethereum, or a DeFi token will do next. It can help you identify crowded trades, conflicting signals, and moments when the market's emotional state deserves more attention.
Table of Contents
- Reading the Room Before You Read the Charts
- What Market Sentiment Analysis Actually Means
- The Four Data Streams That Power Sentiment Signals
- How Popular Sentiment Indices Are Built
- A Practical Workflow You Can Run This Week
- Tools and Dashboards Worth Knowing
- When Sentiment Lies and How to Stay Honest
- Turning Signals Into Decisions Without Burning Out
Reading the Room Before You Read the Charts
A price chart gives you the visible result of thousands of decisions. Sentiment analysis looks for the pressure behind those decisions. The distinction matters because a falling price can reflect panic selling, routine profit-taking, forced liquidations, or a temporary reaction to a headline. Each situation may look similar at first, but each creates a different risk for the next trade.
Crypto participants often feel this shift before they can describe it. Bitcoin starts moving lower, replies become more aggressive, and familiar accounts begin repeating the same phrases. Ethereum holders debate whether activity is moving toward Layer 2 networks or whether capital is leaving the ecosystem altogether. Traders in DeFi discuss liquidation risk, while long-term investors compare tokenomics and real-world adoption. The conversation changes before a simple chart pattern makes the change obvious.
Social mood alone isn't enough. A popular narrative can be amplified by bots, coordinated campaigns, or people who already hold the asset. A whale transfer can represent selling, custody management, an exchange migration, or a smart-contract interaction. A funding rate can show crowded positioning without proving that a reversal is imminent.
Practical rule: Read sentiment as a layer beside price action, liquidity, on-chain behavior, and fundamentals. Never treat it as a replacement for them.
The useful question isn't “Are people bullish or bearish?” It's more precise: Which participants are expressing that view, through which data, and over what time horizon? Social posts may reveal narrative velocity. On-chain records can show whether capital is moving. Derivatives expose hedging. Order flow shows what buyers and sellers are doing right now.
This article builds a practical framework around those four streams. The aim isn't to chase vibes. It's to convert the market's emotional temperature into a disciplined context check that can improve timing, position sizing, and risk awareness.
What Market Sentiment Analysis Actually Means
Think of the market as weather. Price is the temperature, the number you can read immediately. Sentiment is atmospheric pressure, a less visible condition that can hint at instability, changing wind, or a developing storm. Neither measurement tells you everything, but together they provide a more useful description of the environment.
Traditional markets have measured sentiment through investor surveys, options positioning, analyst revisions, and volatility indicators. The American Association of Individual Investors survey, for example, has operated since 1987 and asks respondents whether they're bullish, neutral, or bearish over a six-month horizon. Its recent readings were 34.7% bullish, 27.4% neutral, and 37.9% bearish, compared with long-term averages of 37.5% bullish, 31.5% neutral, and 31.0% bearish. Those figures make the survey a useful historical reference for understanding retail mood, especially when analysts compare current conditions with the survey's own history. (AAII sentiment benchmark)
Financial sentiment research has changed substantially over nearly four decades. Methods moved from simple word-count approaches toward machine learning, deep learning, and hybrid systems that combine news, social media, and price data. A 2025 survey describes this development as a major methodological shift and shows how sentiment analysis became a recognized area of financial economics across the late twentieth and twenty-first centuries. (Survey of financial sentiment analysis)
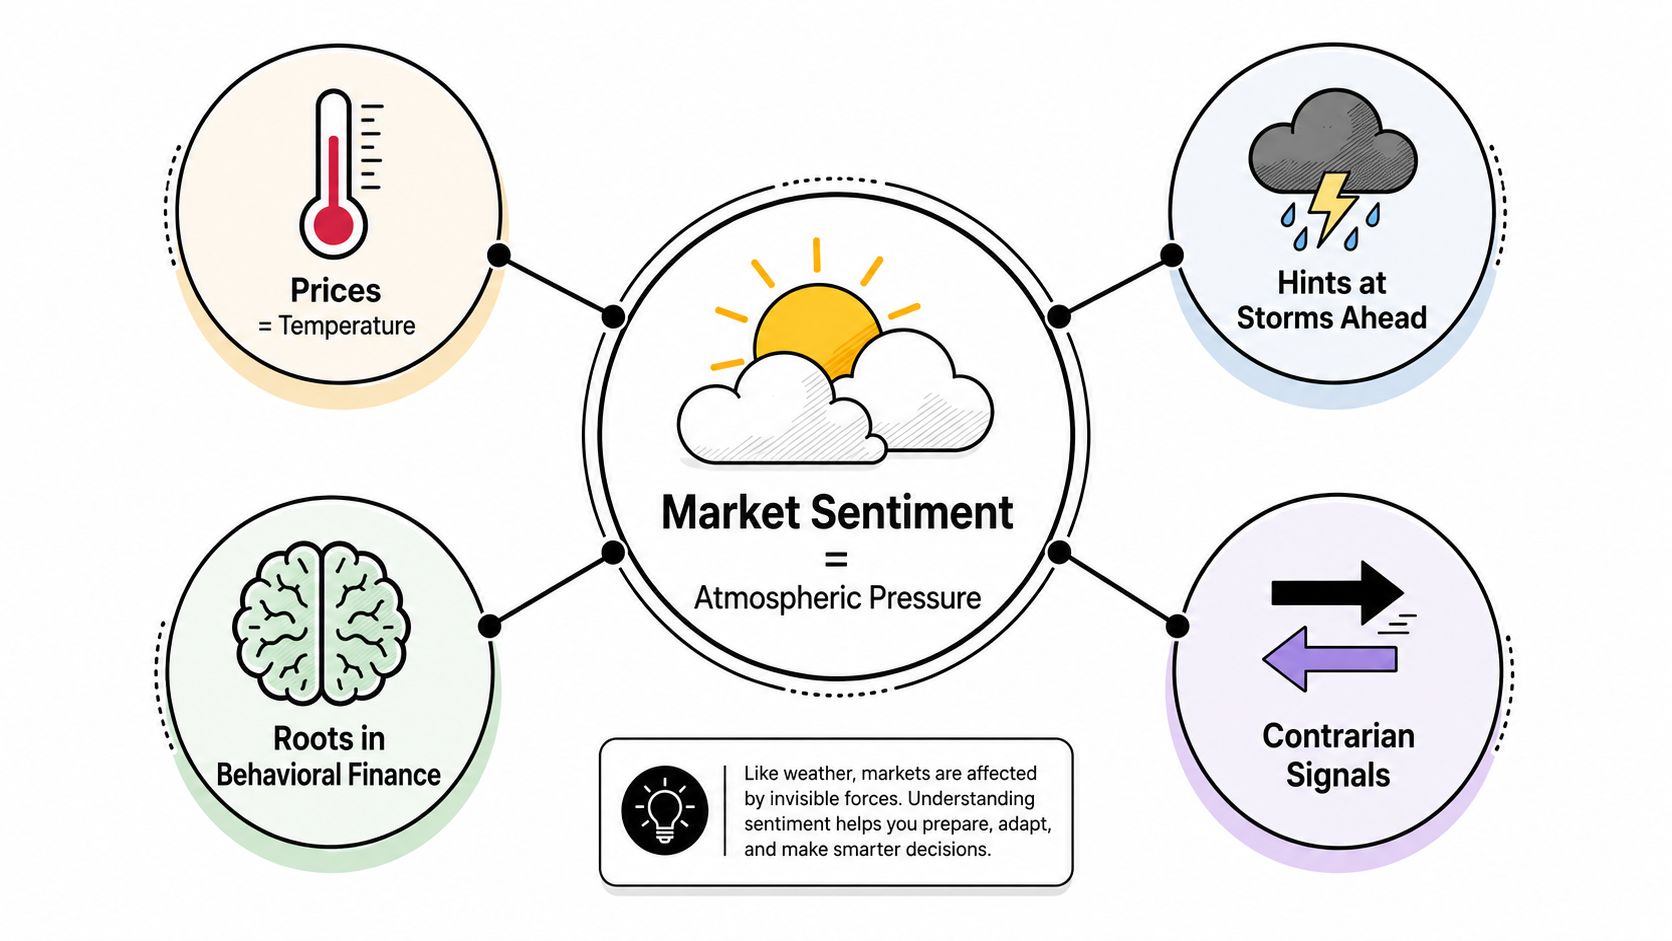
Why crypto requires a wider lens
Crypto markets operate continuously across global venues. Retail communities can influence narratives quickly, and price often reinforces the story that caused the move. Many assets also lack the audited earnings history available for a public company, so participants rely more heavily on network usage, token distribution, developer activity, liquidity, and narrative strength.
In practice, crypto market sentiment analysis means systematically measuring crowd mood and positioning across text, transactions, and trading activity. Analysts may use natural-language processing to classify posts as positive, neutral, or negative, then compare that classification with exchange flows, derivatives data, and market structure.
Voice-of-customer methods offer a useful parallel for understanding how language can be organized into actionable themes. The overview of how Sift AI supports VoC shows why collecting opinions isn't enough without categorization and context. Crypto analysts face the same problem, except the language may be faster, noisier, and more financially consequential.
The four signal families are social, on-chain, derivatives, and order flow. Each captures a different part of the market's behavior. The analysis becomes stronger when they agree, and more cautious when they conflict.
The Four Data Streams That Power Sentiment Signals
A trader sees an Ethereum upgrade trending, stablecoin deposits rising, and perpetual-swap funding turning sharply positive. The market appears confident. Yet those clues describe different behaviors, and they may not point to the same time horizon. A useful sentiment dashboard therefore asks what each stream observes, what it misses, and how quickly its signal fades.
Social signals capture narrative speed
X posts, Reddit discussions, Telegram messages, and YouTube comments show which stories are spreading and how strongly people respond. Analysts can track mentions, engagement, topic changes, and positive, neutral, or negative language. A sudden increase in attention around an Ethereum upgrade, a new Layer 2 incentive program, or an AI and crypto narrative can reveal a fast-moving narrative shift.
Social attention is not the same as buying power. Bots, paid promotion, sarcasm, copied posts, and engagement farming can inflate volume or distort tone. These signals describe what the crowd is discussing and believing, but they do not show whether participants have capital ready to trade.
On-chain signals follow actual movements
Blockchain records connect sentiment to observable transfers. Exchange inflows and outflows, active addresses, stablecoin balances, and whale-wallet activity can indicate changing supply and liquidity conditions. Rising stablecoin liquidity may support risk-taking, while transfers to exchanges can create potential sell-side supply.
The same transaction can have several explanations. An exchange migration, internal wallet reshuffle, bridge transfer, or airdrop-farming campaign may look like conviction while reflecting routine operations. Address labels can be incomplete, and one entity may control many wallets. On-chain data is strongest when paired with information about the asset, venue, and transaction purpose.
Derivatives show crowded bets
Funding rates, open interest, options skew, and long-short ratios describe positioning in perpetual swaps and options. Rising open interest alongside aggressive bullish positioning can identify a crowded trade. Options put/call ratios and implied volatility add clues about hedging demand and expected risk.
A high funding rate does not guarantee a decline, just as negative funding does not guarantee a rally. Expiration dates, basis trades, and market-maker positioning can make the readings noisy. Derivatives often help identify how vulnerable a market is to a squeeze, rather than predict the next candle by themselves.
Order flow shows the live tape
A token can look bullish on social media while the order book absorbs every aggressive bid. Order-book imbalance, aggressive buying and selling, liquidations, and trade execution reveal immediate pressure. These measures help short-term traders distinguish passive bids from buyers actively crossing the spread.
Research using 2,127 trading rules on benchmark indices including the S&P 500 and DJIA found that a technical sentiment indicator can correlate with other sentiment measures, positively predict near-term returns, and show an inverse relationship with longer-term cross-sectional returns. (Technical sentiment indicator research)
The time horizon changes the interpretation. Bullish order flow may support short-term continuation while pointing toward longer-term mean reversion. For a deeper introduction, market microstructure explains how orders, liquidity, and execution shape price formation.
| Data Stream | What It Measures | Key Metrics | Common Pitfalls | Best Used For |
|---|---|---|---|---|
| Social | Narrative tone and attention | Mentions, engagement, polarity | Bots, shilling, sarcasm | Narrative shifts |
| On-chain | Wallet and capital movement | Exchange flows, active addresses, stablecoins | Migrations, farming, unlabeled wallets | Conviction and supply context |
| Derivatives | Positioning and hedging | Funding, open interest, options skew | Expirations, basis trades | Crowding and risk |
| Order flow | Immediate buying and selling pressure | Imbalance, liquidations, aggressive trades | Short lifespan, venue dependence | Timing and regime detection |
No single stream should control a decision. Agreement across independent behaviors strengthens a signal. Conflict is information too. It may indicate that a narrative has outrun capital flows, that positioning is crowded, or that short-term pressure is diverging from the broader market mood. Use the streams as a decision framework, not as four votes that automatically produce a trade.
How Popular Sentiment Indices Are Built
A market can look euphoric on a dashboard while options traders hedge aggressively underneath. The familiar Fear and Greed format reduces that mixed situation to one score. The Crypto Fear and Greed Index uses a 0-to-100 scale, with lower readings indicating fear and higher readings indicating greed. Some versions treat the midpoint as neutral and use below 25 or above 75 for more one-sided conditions. (Crypto Fear and Greed Index framework)
The score is a model output, not a direct measurement like temperature. Each provider chooses which market behaviors to include, how far back to look, and how much influence each input receives. One index may emphasize volatility and momentum, while another gives greater weight to social engagement, Bitcoin dominance, or derivatives.
The inputs change the meaning
CoinMarketCap's Fear and Greed Index uses five components: price momentum, volatility, derivatives market data, market composition, and proprietary social and engagement data. Its methodology compares Bitcoin and Ethereum volatility using 30-day forward-looking implied-volatility indices and includes Bitcoin and Ethereum options put/call ratios in the derivatives component. (CoinMarketCap methodology)
A common framework assigns 25% each to volatility and market momentum, 15% to social media, 10% to Bitcoin dominance, and 10% to Google Trends. In that framework, rising Bitcoin dominance generally signals fear because capital is rotating from altcoins into BTC. Higher social and search activity can instead reflect greed or growing retail attention. (Common crypto sentiment weighting framework)
Those design choices create trade-offs. Equal weighting stops one input from controlling the result, yet it can give noisy social activity the same influence as a more stable market variable. Long lookback windows smooth abrupt changes. Short windows respond faster but can generate more false signals. Survey-based measures capture stated opinions, which may differ from capital deployed.
Compare the construction, not just the score
| Index | Main Inputs | Weighting Method | Update Cadence |
|---|---|---|---|
| Crypto Fear and Greed Index | Fear, greed, price behavior, and market activity | Provider-defined composite | Provider-defined |
| CoinMarketCap Fear and Greed Index | Momentum, volatility, derivatives, composition, social engagement | Component-based composite | Provider-defined |
| Crypto Bull and Bear Index | Market mood and behavioral inputs | Provider-defined composite | Provider-defined |
| Galaxy Bitcoin Sentiment Index | Bitcoin-focused sentiment inputs | Provider-defined composite | Provider-defined |
Two indices can disagree on the same day because they cover different assets, use different lookback periods, or assign different importance to social, derivatives, and price inputs. Live dashboards have shown this clearly, with one crypto index displaying Neutral at 50 while other trackers classified the market as Fear or Greed. (Live crypto sentiment comparison)
Use the score as a screening signal, then inspect the ingredients. Compare it with social tone, on-chain movement, derivatives positioning, and order-flow pressure before treating sentiment as evidence of a trade. For broader qualitative and fundamental context, see this fundamental crypto asset score.
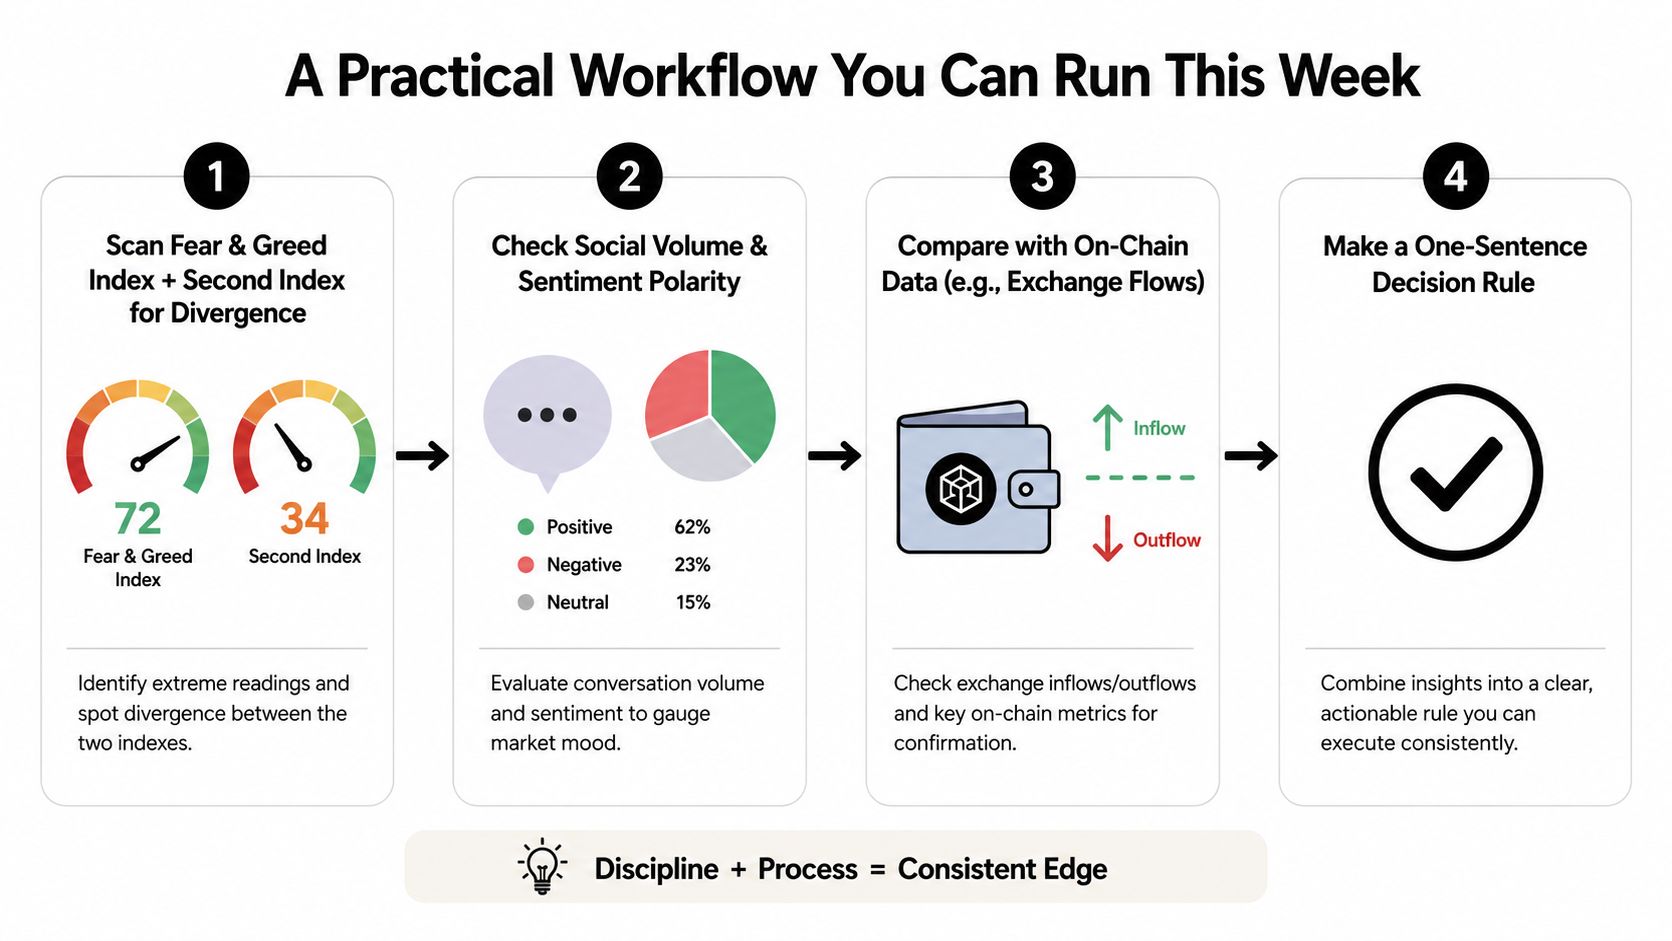
A Practical Workflow You Can Run This Week
A useful routine should reduce noise, not add another screen to your day. Set aside a short weekly review and record the same observations each time. Consistency lets you compare the current mood with your own previous decisions instead of reacting to whichever post appears first.
Start with divergence, not conviction
First, scan the Fear and Greed Index and compare it with a second index. Don't ask which number is correct. Ask why they differ. One may be reacting to volatility, while another is responding more strongly to social activity or Bitcoin dominance.
Second, sample social channels. Look for changes in narrative speed, not just whether posts sound bullish. Are users discussing fundamentals, network activity, and risk, or are they repeating price targets and celebrating every minor move? Treat engagement as attention, not proof of demand.
Third, examine on-chain flow. Review exchange net position change, stablecoin balances on exchanges, and large-wallet movement. Mark unusual transfers for investigation rather than labeling them immediately as accumulation or distribution.
Fourth, inspect derivatives. Funding rates, open interest, and the put/call ratio can reveal whether traders are paying to maintain a crowded view. A positive social mood becomes less comfortable when borrowing is rising rapidly and liquidity is thinning.
Write one sentence before you trade
End the review with a plain-language decision rule. For example: “Social mood is optimistic, derivatives are crowded, and on-chain flows don't confirm demand, so I won't add risk until positioning cools.” Or: “Fear is broad, and exchange outflows support a patient accumulation plan.”
The point isn't to sound certain. It's to make your reasoning visible.
A worked example needs careful boundaries. During a Bitcoin consolidation phase, conflicting signals might include improving social tone but heavy open interest, or quiet social channels alongside stronger exchange outflows. In the first case, a trader might avoid chasing a breakout. In the second, they might keep an existing position while waiting for price confirmation rather than selling solely because the timeline feels quiet.
Don't convert that observation into a guaranteed historical trade result. The workflow is a way to frame uncertainty. Position sizing, invalidation levels, and scenario-based allocation limits, such as those discussed in this scenario-based allocation limits guide, should determine how much capital is exposed.
Use horizon-specific interpretation
Intraday traders may prioritize order flow and high-frequency social events. Swing traders can combine funding, open interest, and narrative changes. Long-term Bitcoin or Ethereum investors may give greater weight to network activity, supply behavior, adoption, and broader market structure.
Research on crypto tweets found that high-frequency sentiment affected log returns, liquidity, and jumps around tweet events across four major assets, using five-minute intraday data and event-study methods. Negative sentiment produced immediate volatility spikes, neutral sentiment improved liquidity, and positive sentiment had a more delayed and persistent effect on price and trading activity. (High-frequency crypto sentiment research)
Tools and Dashboards Worth Knowing
No dashboard can observe every part of market psychology. Choose tools by the question you're asking, then combine a small number of specialized views instead of relying on one all-in-one score.
Santiment, LunarCrush, and The Tie are useful for different forms of social and narrative analysis. They can help you study mention volume, engagement, sentiment classification, and attention around assets or themes. Their paid tiers may provide deeper historical data, broader coverage, or more advanced filtering than free interfaces.
Coinglass and Laevitas focus heavily on derivatives. Funding rates, open interest, liquidation data, options activity, and implied volatility can help you identify crowded positioning. CoinGlass also appears in order-flow workflows, although users should distinguish between its derivatives dashboards and any separate execution or market-depth tools.
Glassnode, CryptoQuant, and Nansen support on-chain research. They differ in data coverage, wallet labeling, exchange metrics, and presentation. Nansen's labeled-wallet approach can be particularly useful when you need to investigate entities, while Glassnode and CryptoQuant offer broad market and network datasets.
For order flow, traders may use Hyblock or Exocharts alongside exchange-native order books. These tools are most relevant when the question is immediate execution pressure, liquidation clusters, or market-depth behavior. Order flow changes quickly, so it shouldn't be treated like a long-term fundamental variable.
| Tool Category | Example Platforms | Best Used For |
|---|---|---|
| Social sentiment | Santiment, LunarCrush, The Tie | Narrative tone and attention |
| Derivatives | Coinglass, Laevitas | Funding, open interest, options |
| On-chain analytics | Glassnode, CryptoQuant, Nansen | Wallet and exchange activity |
| Order flow | CoinGlass, Hyblock, Exocharts | Liquidations and live positioning |
| Portfolio tracking | Dedicated trackers and exchange integrations | Exposure, allocation, and trade records |
A layered stack usually works better than a crowded one. Start with one sentiment platform, one on-chain provider, and one derivatives dashboard. Readers comparing tracking options can also review crypto portfolio trackers before deciding how to document exposure.
Coiner Blog is another content resource for following Bitcoin, Ethereum, DeFi, Web3, NFTs, crypto gaming, tokenomics, AI and crypto, Layer 2 networks, and real-world asset tokenization alongside market analysis. Use educational coverage to understand the asset, then verify live data in the relevant specialist dashboard.
When Sentiment Lies and How to Stay Honest
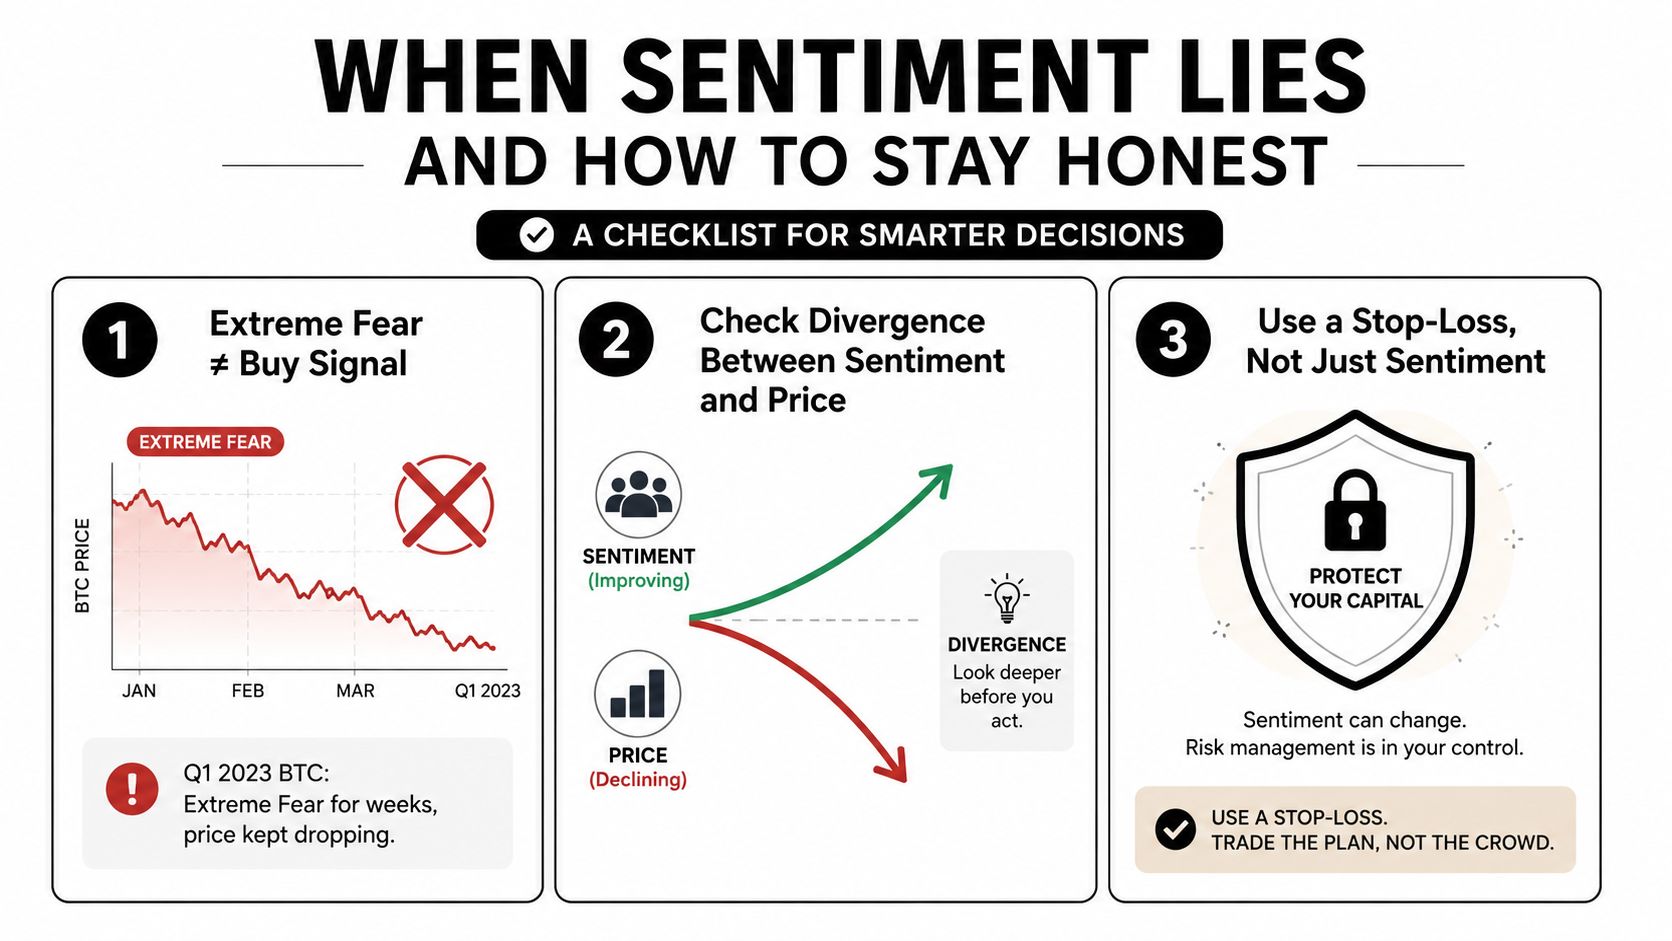
A Fear and Greed reading can show extreme fear while price keeps falling. The score captures what participants feel, not the remaining supply of sellers, the strength of demand, or whether a fundamental problem has been resolved. Treat it as a question to investigate, not a trade instruction.
Retail enthusiasm creates a similar trap. Social mentions and Google Trends may rise as larger holders distribute through private or over-the-counter channels. Public excitement can exist alongside institutional hedging, a weak futures basis, or unfavorable exchange flows. The disagreement between these signals often carries more information than any single reading.
Extreme sentiment is a condition to investigate, not an instruction to enter.
Time horizon changes the meaning of a sentiment signal. Rule-based indicators can align with near-term return direction while showing an inverse relationship with longer-term cross-sectional returns. A bullish reading may therefore support continuation over a short window, yet call for a different interpretation when considering a multi-month allocation.
Run an honesty checklist
- Check index disagreement: Compare each score's inputs, asset coverage, and update method before treating two indices as equivalent.
- Test derivatives confirmation: Ask whether funding, open interest, and options positioning support or contradict the stated mood.
- Prioritize behavior over language: Give persistent wallet and exchange patterns more weight than the latest viral post.
- Separate participants: Retail mood, institutional positioning, and crypto-native trading activity can point in different directions.
- Define invalidation: Decide which observation would prove the sentiment thesis wrong before entering.
Asset selection also sets a boundary around usefulness. Research using large Twitter datasets found strong positive correlations between Bitcoin and Ethereum and market-related or technology-related sentiment, while meme coins were less predictable from those news signals. Sentiment analysis is therefore easier to defend when tied to major assets and broad narratives than when used as a standalone trigger for every token. (Twitter sentiment and crypto assets research)
This video offers another way to examine emotional decision-making and behavioral errors in trading:
For a focused examination of trader psychology, this crypto trading bias guide can help identify personal habits that distort sentiment readings.
Turning Signals Into Decisions Without Burning Out
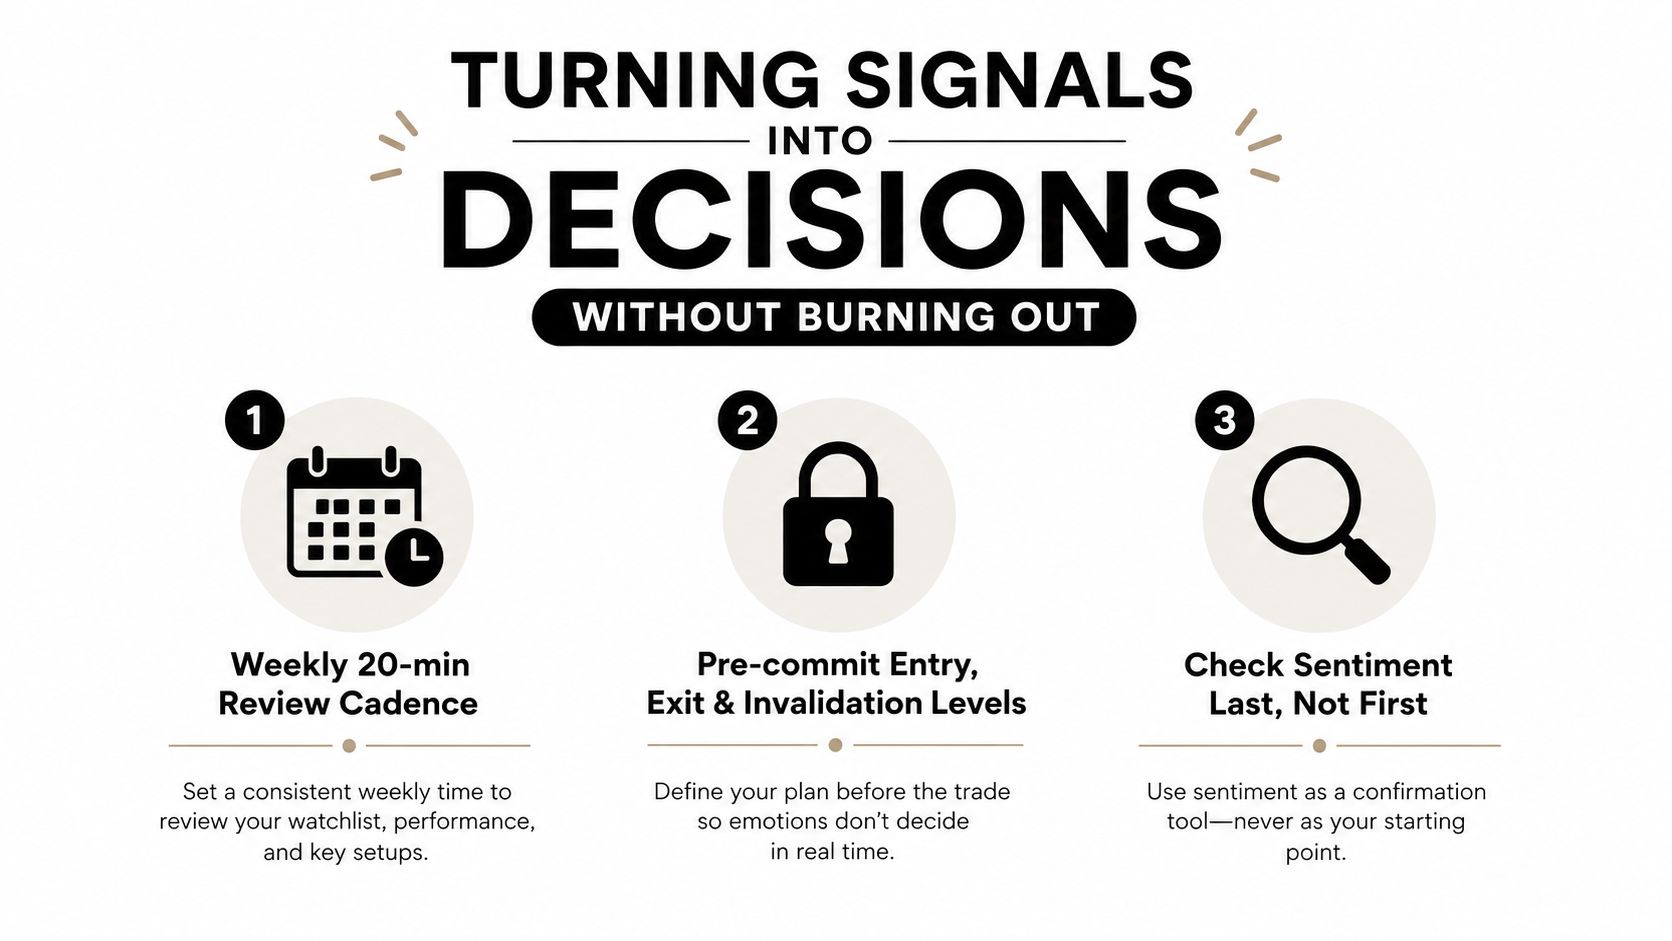
Sentiment analysis earns its place by making your process calmer and more repeatable. A weekly review can be enough for many swing and long-term participants, while active traders may need a separate intraday routine for order flow and liquidation events.
Write down your entry, exit, and invalidation levels before checking the sentiment dashboard. That order protects you from changing the plan because the latest score confirms what you already want to believe. When signals conflict, reduce position size rather than increasing it to recover a disappointing trade.
Keep a journal entry for every meaningful decision. Record the sentiment snapshot, the data streams that agreed or disagreed, the time horizon, and what eventually invalidated or supported the view. Over time, you'll learn whether sentiment improves your decisions or merely gives your instincts a more technical vocabulary.
The durable edge isn't certainty. It's knowing when your evidence is weak and adjusting risk accordingly.
Sentiment is best used as a filter and risk overlay. It can highlight crowding, divergence, and changing narrative pressure, but it can't replace research into tokenomics, smart-contract risk, network usage, liquidity, or regulation. Treat every signal as a probabilistic tilt, not a crystal ball.
Visit Coiner Blog for practical coverage of crypto markets, blockchain technology, DeFi, Web3, tokenomics, and market sentiment. Use its guides and analysis to build context around an asset, then apply the multi-stream workflow to test whether social, on-chain, derivatives, and order-flow evidence agree.