
Market Microstructure Guide for TradFi and Crypto

More than 40% of daily Ethereum volume happens on automated market makers rather than order books according to Morpher's overview of crypto market structure. That single fact changes how you should think about trading.
If you learned markets through stocks, futures, or ETFs, you probably picture buyers and sellers meeting in an order book. In crypto, that picture is only half right. Bitcoin still trades heavily on centralized venues. Ethereum trades across centralized exchanges, decentralized exchanges, bridges, aggregators, and bots competing for blockspace. The rules that determine who gets filled, at what price, and with what hidden cost are different.
That's what market microstructure is really about. Not the broad story of why an asset should be worth more or less, but the fine detail of how prices form in practice. It covers spreads, order flow, execution quality, liquidity depth, slippage, and the frictions traders pay. In crypto, it also includes AMM design, fragmentation across venues, gas auctions, and MEV.
Readers often get stuck because microstructure sounds abstract. It isn't. It explains why the same trade can be cheap on one venue and expensive on another, why a token can look liquid until your order hits it, and why protocol design choices inside smart contracts shape execution just as much as trader sentiment does.
Table of Contents
- Introduction to Market Microstructure
- Foundations of Market Microstructure
- Trading Mechanics in Traditional Finance
- Crypto Specific Market Structures
- Metrics and Measurement Across TradFi and Crypto
- Strategies and Practical Takeaways
- Real World Case Studies
- Conclusion and Next Steps
Introduction to Market Microstructure
Market structure looks simple from a chart. A price prints, volume shows up, and the candle closes. But the chart hides the machinery underneath.
Take Ethereum. A trader swapping tokens on an AMM faces pool depth, slippage, and gas costs. Another trader on a centralized exchange faces the spread, queue position, and matching-engine rules. Both traders are buying “the same market” in a loose sense, but they are interacting with very different systems. Those systems determine execution quality.
For builders, the stakes are just as high. A DeFi protocol that ignores transaction ordering or liquidity concentration can create bad user outcomes even if the app interface looks polished. A market maker that ignores fragmentation across venues can miss better prices. A retail trader who only watches the quoted price can underestimate the cost of entering and exiting.
Practical rule: Price is only part of the trade. Execution is the other part.
The value of market microstructure is that it turns hidden mechanics into something you can inspect. It helps explain why a spread widens, why slippage jumps, why a large order moves the market, and why crypto often behaves differently from familiar TradFi models. Once you see those moving parts clearly, a lot of confusing market behavior starts to make sense.
Foundations of Market Microstructure
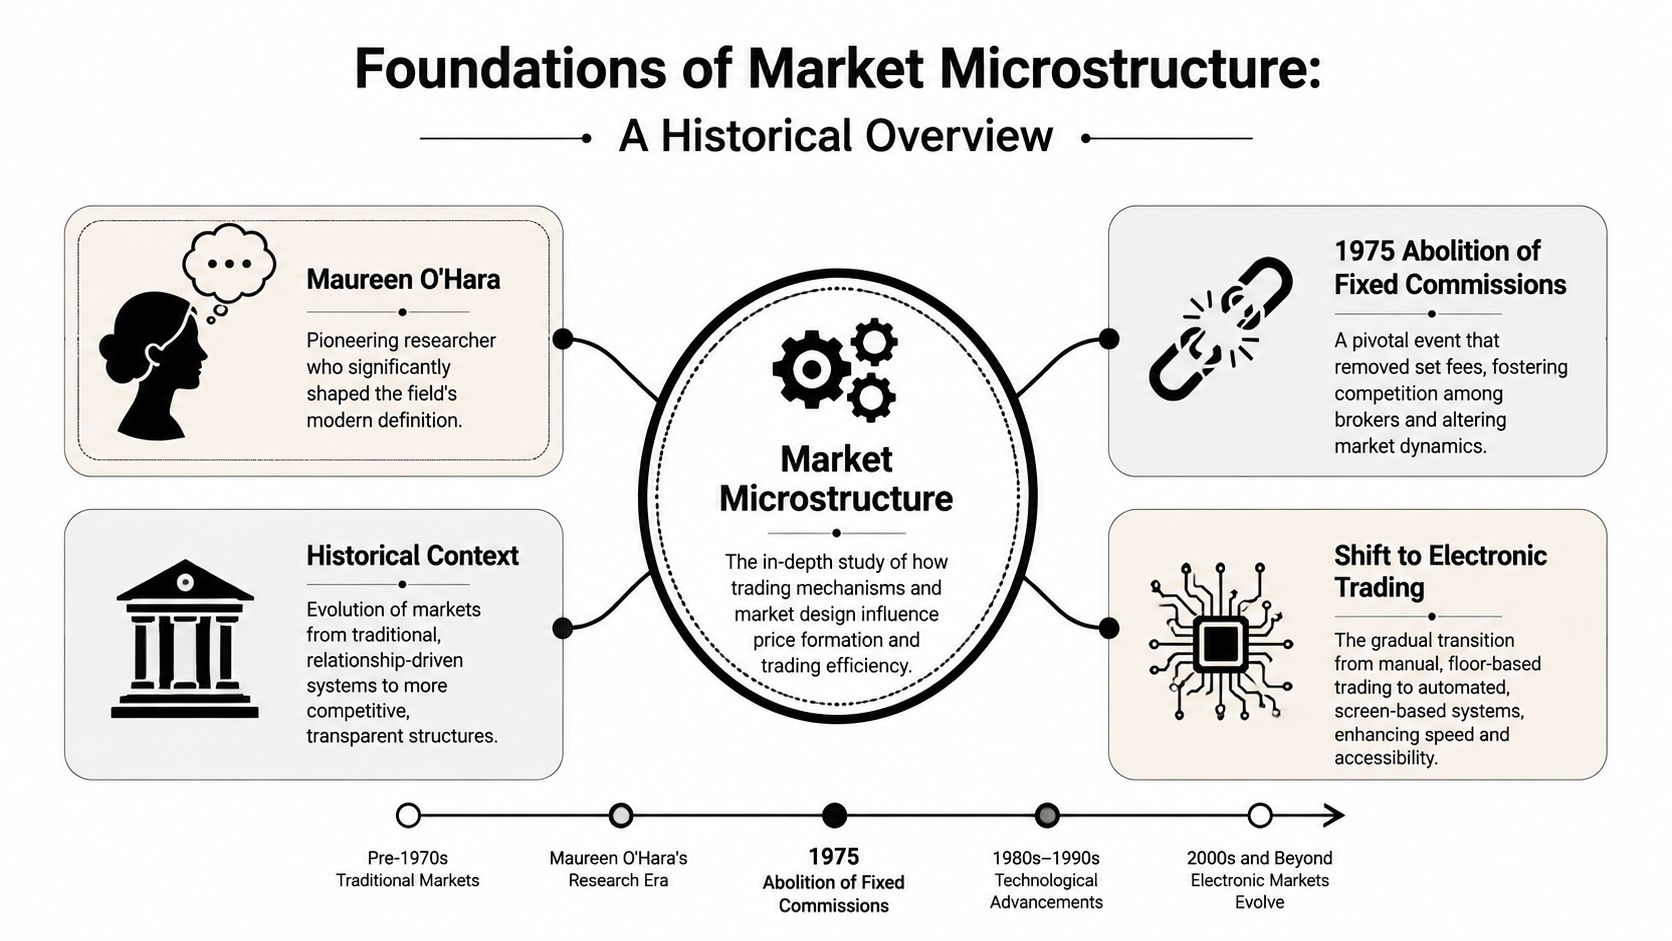
Market microstructure asks a practical question: what happens between the moment a trader decides to buy or sell and the moment the trade is complete? In academic terms, it is the study of the process and outcomes of exchanging assets under explicit trading rules, a definition associated with Maureen O'Hara and summarized in the market microstructure overview on Wikipedia.
Why the field exists
Traditional finance long relied on models that treated markets as if prices adjusted cleanly and trading friction barely mattered. Microstructure shifted the focus from the final price to the machinery that produces it. Who is posting liquidity? Who is consuming it? Which orders get priority? How much does a trader lose to spread, delay, fees, or information leakage before the trade is even done?
Hans Stoll highlighted a central problem in that machinery: the gap between an ideal efficient market and the actual cost of transacting inside one. A market can look efficient on a chart while still charging meaningful hidden tolls through spreads, commissions, queue position, and market impact.
A weekend produce market works as a comparison. If many buyers and sellers gather in one place, prices are close together and deals happen quickly. If only a few stalls are open, or if sellers can change the order of customers in line, trading gets harder and more expensive. Financial markets work the same way. The quote is the visible sign. The trading rules create the actual experience.
Rules change outcomes
The field gained momentum once researchers could study how market design altered behavior. Changes in commission rules, tick sizes, and trading technology made it easier to see that prices do not emerge from theory alone. They emerge from interaction under a rulebook.
One example is decimalization in U.S. equities. As noted earlier, reducing the minimum tick size narrowed quoting increments and helped compress spreads in many names. That was not a change in investor opinion about value. It was a change in the size of the steps traders could use when competing on price.
Electronic trading pushed the field forward for another reason. It created detailed records of orders, cancellations, and executions. That made microstructure measurable. Researchers and practitioners could examine quoted spread versus effective spread, short-term price impact, fill rates, and how quickly prices incorporated new information.
Those ideas matter even more in crypto because the rulebook is broader. In equities, the matching engine and exchange rules do most of the work. In crypto, execution may depend on an order book, an automated market maker, a block builder, validator ordering, gas fees, and liquidity split across many venues at once. The same trade intent can face very different costs depending on where and how it is routed.
Here are the core foundations to keep in mind:
- Rules create incentives. Tick size, fee structure, queue priority, and smart contract logic affect who supplies liquidity and who pays for immediacy.
- Liquidity depends on trade size. A market may look cheap for a small order and become expensive once the order starts pushing through visible depth or pool reserves.
- Price discovery is mechanical. It comes from submitted orders, canceled orders, routing choices, and execution priority, not from an abstract market clearing itself.
- Data makes friction visible. Trade, quote, and on-chain execution records let analysts measure spread, slippage, adverse selection, and price impact.
Markets discover price through rules, incentives, and execution mechanics.
That principle is the bridge between classic market microstructure and crypto microstructure. TradFi taught the field to study spreads, depth, and information asymmetry. Crypto adds new forms of market design, especially AMMs, MEV, and venue fragmentation, that change where friction appears and who captures it.
Trading Mechanics in Traditional Finance
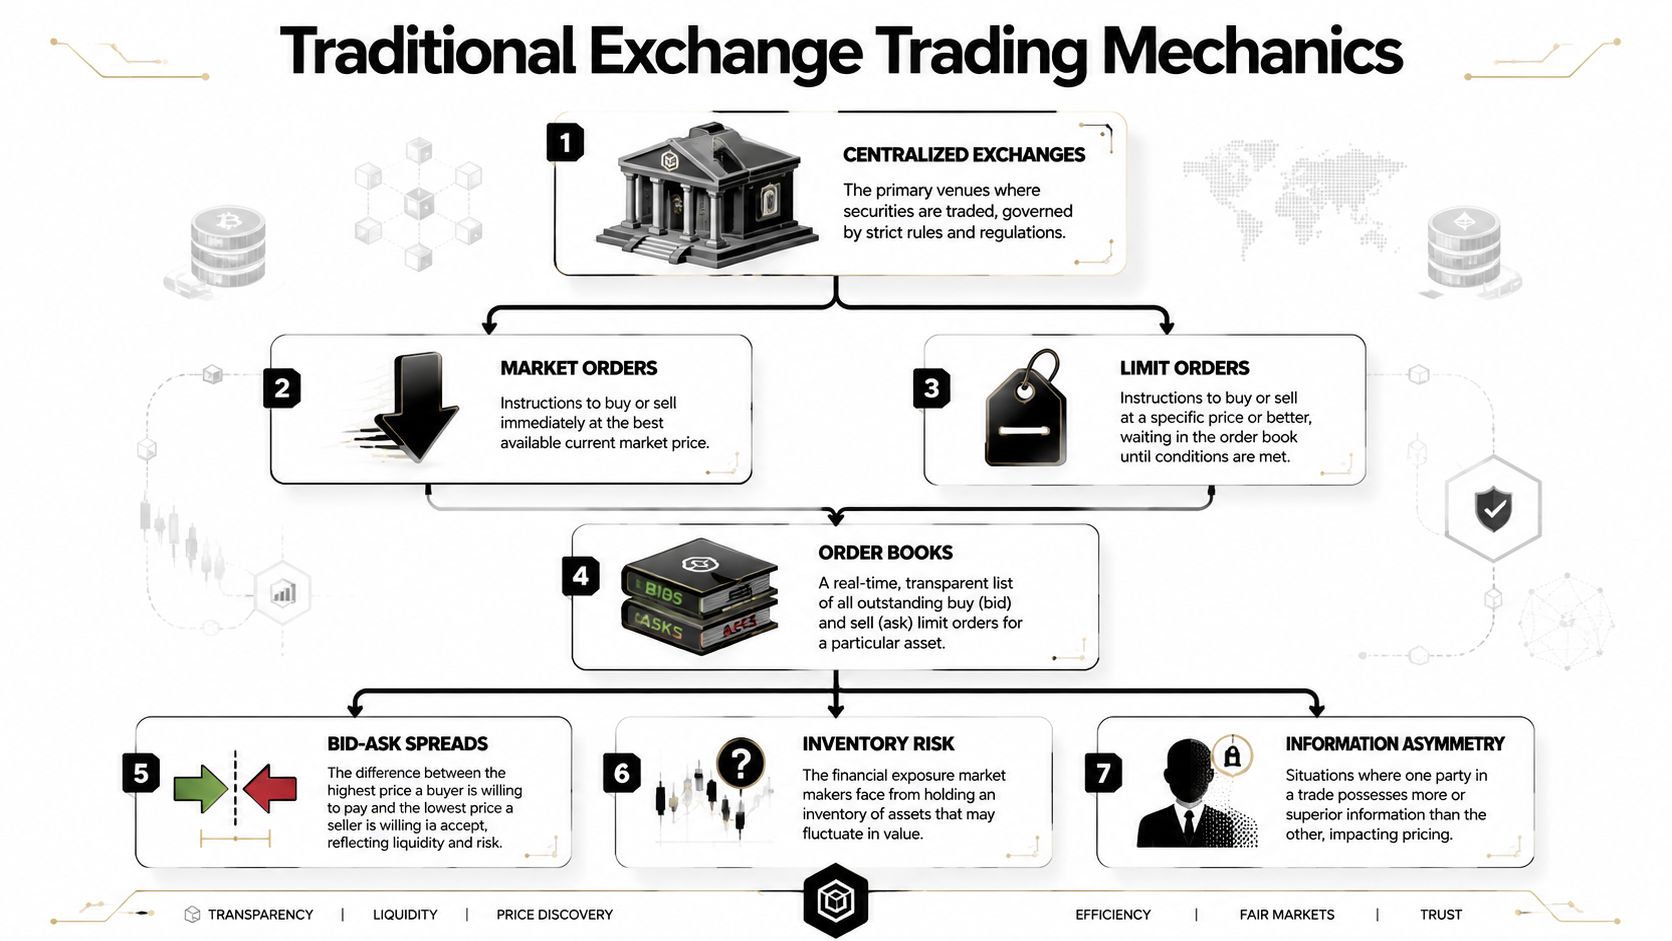
A centralized exchange runs on a straightforward promise. Buyers submit bids, sellers submit asks, and the venue matches them according to explicit rules.
How the order book works
A market order says, “fill me now at the best available price.” A limit order says, “fill me only at this price or better.” Limit orders rest in the book until someone trades against them or the trader cancels them.
The order book is the live list of those resting bids and asks. The highest bid and lowest ask define the visible spread. Depth matters just as much as the top quote because a larger order may eat through several price levels.
Think of Apple stock. If many buyers and sellers line up near the current price, execution tends to be smoother. If few orders sit near the top of the book, even a moderate trade can move the execution price away from the quote the trader first saw.
A closely related process in ETF markets is the creation and redemption mechanism, which helps align trading prices with underlying value. If you want a refresher on that plumbing, Coiner Blog's piece on the ETF creation redemption process is a useful companion.
Why spreads appear
Spreads are not random gaps. They compensate liquidity providers for risk. In highly liquid U.S. large-cap equities, the average bid-ask spread typically sits between 0.01% and 0.05% of share price, while less liquid assets can see spreads of 1% to 5%, according to Hans Stoll's paper on market microstructure and trading costs.
Two forces sit behind that gap:
- Inventory risk: A market maker who buys from a seller may need to hold the position before offloading it.
- Information asymmetry: The trader on the other side may know something the market maker doesn't.
When volatility rises, those risks rise too. In electronic limit order book settings, spread width is often modeled as scaling with volatility and adverse selection. Terence Lim's notebook on market microstructure in electronic markets notes that spreads can widen sharply during more volatile periods because liquidity providers face greater adverse selection costs.
What experienced traders watch
Quoted spread is the posted gap. Effective spread is the gap implied by where a trade executes relative to the midpoint. The second figure often tells the more honest story because it captures slippage and timing.
Broker choice also matters because routing, fees, and execution tools shape outcomes. Traders comparing platforms can use resources like Rize Trade's guide to evaluate trading brokers Lightspeed and IBKR to think through how tools and workflow affect execution quality rather than just headline commissions.
A tight quote doesn't guarantee a cheap trade. What matters is the price you actually get.
Crypto Specific Market Structures
Crypto changes market microstructure at the matching engine level, the settlement level, and even the transaction-ordering level. A stock trader can usually assume one venue matches orders and another system clears them later. In crypto, those layers often blur together. The result is a market where execution costs come from more than spread and slippage.
Order books and pools are not the same machine
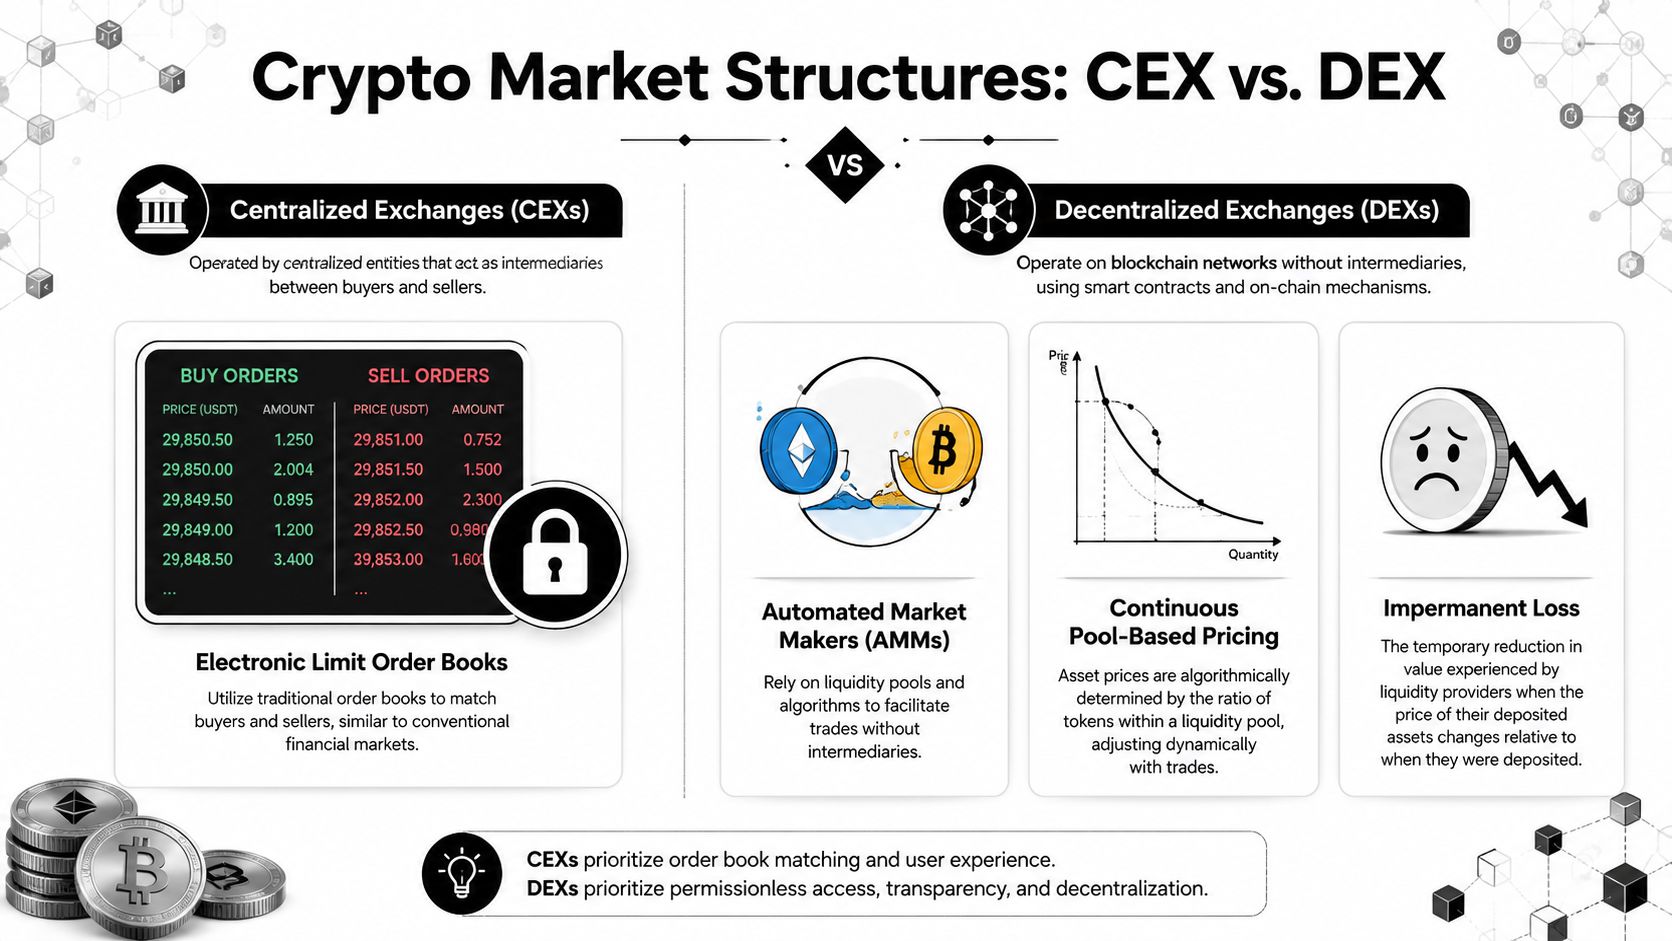
Centralized exchanges still look familiar to anyone who has traded equities, futures, or FX electronically. Orders rest in a limit order book, traders compete for queue position, and execution depends on who posts first, who cancels fastest, and how much size sits near the best bid and ask.
A decentralized exchange built on an AMM works more like a vending machine that updates its price after each purchase. You are not waiting for a specific seller to meet your buy order. You trade against a pool of assets, and the smart contract adjusts the exchange rate as the pool balance changes. That is why a swap on an AMM can feel simple at the interface level but still produce complex execution underneath.
For readers who want the mechanics behind pool pricing, fees, and liquidity provision, this guide to automated market makers gives the background.
That design changes what liquidity means.
In an order book, liquidity is visible as posted size at each price level. In an AMM, liquidity is embedded in reserves and in the pricing curve itself. A pool can look large, yet still give poor execution for a bigger order if usable liquidity thins out quickly as the trade moves along the curve. Multi-hop routing adds another layer because the final price depends on every pool touched along the route, not just the token pair the trader sees on screen.
Three crypto-native frictions follow from that structure:
- Curve-based pricing: Price updates continuously as trades change token balances in the pool.
- Impermanent loss: Liquidity providers can earn fees and still lag a simple buy-and-hold position when relative prices move sharply.
- Inclusion costs: Execution depends partly on gas fees and blockspace competition, not just on displayed liquidity.
Later, one more issue appears. Public transaction visibility can expose a trade before it settles.
Fragmentation and MEV change execution
Crypto also lacks one of the quiet conveniences of traditional equity markets: a unified view of the best available price. Quantdecoded describes a market split across over 500 exchanges globally, with no consolidated tape and no NBBO rule in its article on crypto fragmentation and arbitrage. For a trader, that means the displayed price on one venue may be stale, isolated, or inferior to what exists elsewhere.
Fragmentation matters in practice because crypto trading is spread across centralized exchanges, on-chain DEXs, layer-2 networks, and cross-chain bridges. Each venue has its own fees, latency, custody rules, and liquidity profile. In traditional finance, market structure research often starts by asking how orders interact inside one book or across a tightly linked set of venues. In crypto, you often have to ask a harder question first: where is the primary market for this asset right now?
Bitwyre, summarizing work by Makarov and Schoar, notes that 80% of Bitcoin returns are explained by common volume components across exchanges in this analysis of cryptocurrency market microstructure. Prices still move together, but execution does not become uniform just because prices are correlated. That gap between shared price direction and scattered liquidity is one of the clearest ways crypto departs from textbook microstructure.
Then there is MEV, or maximum extractable value. In plain terms, MEV is the profit available to whoever controls or influences transaction ordering in a block. A visible swap can attract searchers who insert trades before it, after it, or around it. The classic example is a sandwich attack, where the attacker buys first, lets the victim push the price further, then sells into that move.
That creates a cost category with no close equivalent in most retail TradFi execution. A stock trader worries about spread, fees, queue position, and market impact. A DeFi trader worries about those forces plus mempool exposure, gas auctions, routing logic, and whether the trade itself broadcasts a profitable signal before final settlement. In crypto microstructure, the market is not only where orders meet. It is also where code, validators, and searchers compete to decide whose order gets seen first and whose gets priced worst.
Metrics and Measurement Across TradFi and Crypto
Microstructure gets useful when you can measure it. The right metrics help you separate “looks liquid” from “trades liquid.”
The core measurements
In order-book markets, traders usually begin with spread, depth, and price impact. Spread tells you the immediate toll for crossing the market. Depth tells you how much size sits near the top. Price impact tells you how much the trade itself moves the market.
In crypto AMMs, those same questions remain, but the math shifts. Instead of reading a ladder of bids and asks, you inspect pool reserves, route quality, and expected slippage across a path. If Ethereum, a stablecoin, and a long-tail token all sit in the route, each hop adds its own friction.
Researchers have also found stable cross-asset patterns in crypto limit-order-book data. Order flow imbalance, spreads, depth, and trade arrival patterns explain a substantial fraction of return variation at very short horizons, and those mechanisms appear scale-invariant across assets from BTC to smaller altcoins, according to the arXiv paper on cryptocurrency limit-order-book microstructure.
For hands-on data collection in traditional markets, developers who build their own monitoring stack sometimes use guides like WebscrapingHQ's tutorial on WebscrapingHQ for stock data extraction to think through collection workflows and tooling.
Key Liquidity Metrics Comparison
| Metric | TradFi Measurement | Crypto AMM Measurement |
|---|---|---|
| Bid-ask spread | Best bid versus best ask on the order book | Not usually displayed in the same way. Traders infer cost from quoted swap output and route quality |
| Effective spread | Execution price relative to midpoint | Execution versus expected pool quote at submission |
| Depth | Shares or contracts resting near the top of book | Token reserves and usable depth before slippage becomes unacceptable |
| Price impact | Change in market price caused by the trade | Change in pool price along the swap curve |
| Order flow imbalance | Difference between buying and selling pressure in book events | Net swap direction through a pool or route over short intervals |
| Execution priority | Queue position and exchange matching rules | Gas price, inclusion priority, and transaction ordering |
For a more focused look at crypto trading depth and how traders evaluate it, Coiner Blog's article on the liquidity of cryptocurrency fits neatly beside these metrics.
What these readings mean in practice
A useful habit is to compare quoted cost with realized cost. In TradFi, that means comparing the screen quote with the average fill. In DeFi, it means comparing expected output with final output after slippage and ordering effects.
You should also separate visible liquidity from reliable liquidity. Some venues look deep until volatility hits. Some pools look efficient until a larger swap pushes too far along the curve.
Reliable liquidity is liquidity that still works when you need size, speed, or certainty.
For advanced desks, the next step is event-by-event monitoring. Watch where trades cluster, where depth disappears, and whether execution worsens at the same time gas or volatility rises. That's where microstructure stops being theory and starts becoming an operating dashboard.
Strategies and Practical Takeaways
Microstructure matters because it changes decisions. The right response depends on whether you trade markets or design them.
For traders
Execution starts before you click buy.
- Slice larger orders carefully. A smaller sequence can reduce visible impact in order books and limit how much an AMM swap walks up a pricing curve.
- Compare venues, not just prices. In fragmented crypto markets, a visible quote may still produce worse execution than a routed or aggregated path.
- Use MEV-aware workflows. On-chain traders should think about private routing or execution methods that reduce exposure to hostile ordering.
- Track realized slippage. Keep a record of what you expected to pay and what you paid. That gap reveals whether your strategy suffers from impact, latency, or poor route selection.
Performance review matters too. If you want to separate allocation skill from execution quality, a framework like Captapi's complete guide to attribution can help you think more clearly about what drove the result.
Here's a simple trader checklist:
- Check market depth first. A narrow quote can hide fragile liquidity.
- Decide whether urgency is worth the cost. Market orders buy speed. They also buy friction.
- Review the route. On-chain swaps often succeed or fail based on the path, not just the destination pair.
- Measure after the trade. Keep notes on spread paid, slippage, and timing.
For protocol builders
Builders face the same economic forces from the other side. If you're designing a DEX, router, vault, or Layer 2 order book, market microstructure isn't optional product polish. It is core product design.
Consider these design choices:
- Fee curves: A flat fee is easy to explain, but it may not handle volatile conditions or concentrated liquidity well.
- Anti-front-running tools: Batch auctions, private order flow, and better routing logic can improve user outcomes.
- Gas efficiency: Every extra on-chain step changes who can participate and who gets priced out.
- Liquidity placement: Incentives should reward usable depth, not just headline TVL.
Good protocol design reduces hidden costs for honest users and raises costs for extractive behavior.
This also connects to adjacent topics in Web3. Layer 2 networks change inclusion speed and fee conditions. Smart contract design changes routing and failure modes. Tokenomics can attract liquidity, but poor market design can still make that liquidity hard to use in practice.
Real World Case Studies
Theory gets clearer when you put a trade through the machinery.
A large Bitcoin order and venue choice
A $10 million Bitcoin order executed on a single exchange incurs approximately 0.15% market impact under normal conditions, while the same order executed through an institutional OTC desk with cross-venue aggregation can achieve similar execution at 0.05% market impact, according to the YouTube discussion cited in the verified data.
That example captures several microstructure ideas at once. A single venue may not hold enough nearby liquidity to absorb the order cheaply. An OTC desk with access to multiple venues and counterparties can spread the order, reduce signaling, and avoid pushing too hard into one book.
The lesson isn't that OTC is always better. It's that liquidity is path-dependent. Where and how you execute often matters as much as the decision to trade.
AMM arbitrage between pools
Now take a DeFi example. Suppose Uniswap and SushiSwap show different implied prices for the same token pair after a burst of trading. An arbitrageur notices the gap and buys where the token is cheaper, then sells where it is richer.
The mechanics differ from an order book arbitrage. The trader isn't lifting a posted ask on one venue and hitting a posted bid on another in the same way. They are moving along two pool curves. Their profit depends on pool depth, swap fees, gas, and whether another bot gets there first.
Many readers encounter difficulty with this concept. In an AMM, arbitrage doesn't just exploit pricing. It also helps restore pricing by pushing pools back toward broader market levels. Arbitrage is both a trading strategy and part of the price-discovery process.
MEV and transaction ordering
A third case sits even deeper in the stack. A trader submits a swap on Ethereum. Searchers detect that the transaction will move a pool price. One searcher builds a bundle that inserts a buy before the swap and a sell after it. If the bundle lands, the searcher captures value from the transaction ordering itself.
You don't need precise block-level measurements to understand the microstructure point. The order in which valid transactions settle is itself economically valuable. In DeFi, execution quality depends not only on price and liquidity but also on who sees your order, when they see it, and whether they can act before final settlement.
The blockchain mempool is not just a waiting room. It can be an auction for priority.
For traders, that means execution risk can exist even when a pool looks deep. For builders, it means user protection requires more than surface-level UI design.
Conclusion and Next Steps
Market microstructure studies the small rules that create big outcomes. In traditional finance, that means order books, spreads, queue priority, and market maker risk. In crypto, it expands to AMMs, fragmented venues, gas-priority execution, and MEV.
The most important mindset shift is simple. Don't treat a market price as the full story. Treat it as an invitation to inspect the mechanism behind it. That mechanism determines whether liquidity is real, whether the quoted price is trustworthy, and whether your trade will settle the way you expect.
For traders, the practical next step is to build a routine around execution review. Check depth before sending size. Compare expected versus realized outcomes. Watch where fragmentation or ordering risk changes the cost of trading Bitcoin, Ethereum, or smaller tokens. If you use DeFi heavily, pay special attention to route quality, slippage settings, and whether your workflow exposes you to avoidable MEV.
For builders, the next step is design discipline. Smart contracts, fee logic, transaction flow, and liquidity incentives all shape market quality. That applies to DEXs, routing systems, Web3 apps, and emerging Layer 2 order-book designs. It also matters in adjacent areas such as tokenized real-world assets and AI-assisted execution, where infrastructure choices will influence fairness and efficiency just as much as user growth does.
Keep one final principle in mind. Better market structure doesn't remove risk. It makes risk visible. That alone is a major edge.
Coiner Blog publishes practical, plain-English analysis for readers who want to understand crypto market mechanics without the hype. If you're exploring Bitcoin, Ethereum, DeFi, Layer 2 networks, tokenomics, or the trading infrastructure behind Web3, visit Coiner Blog for more guides and research-driven explainers.