
What Is Fear and Greed Index in Crypto
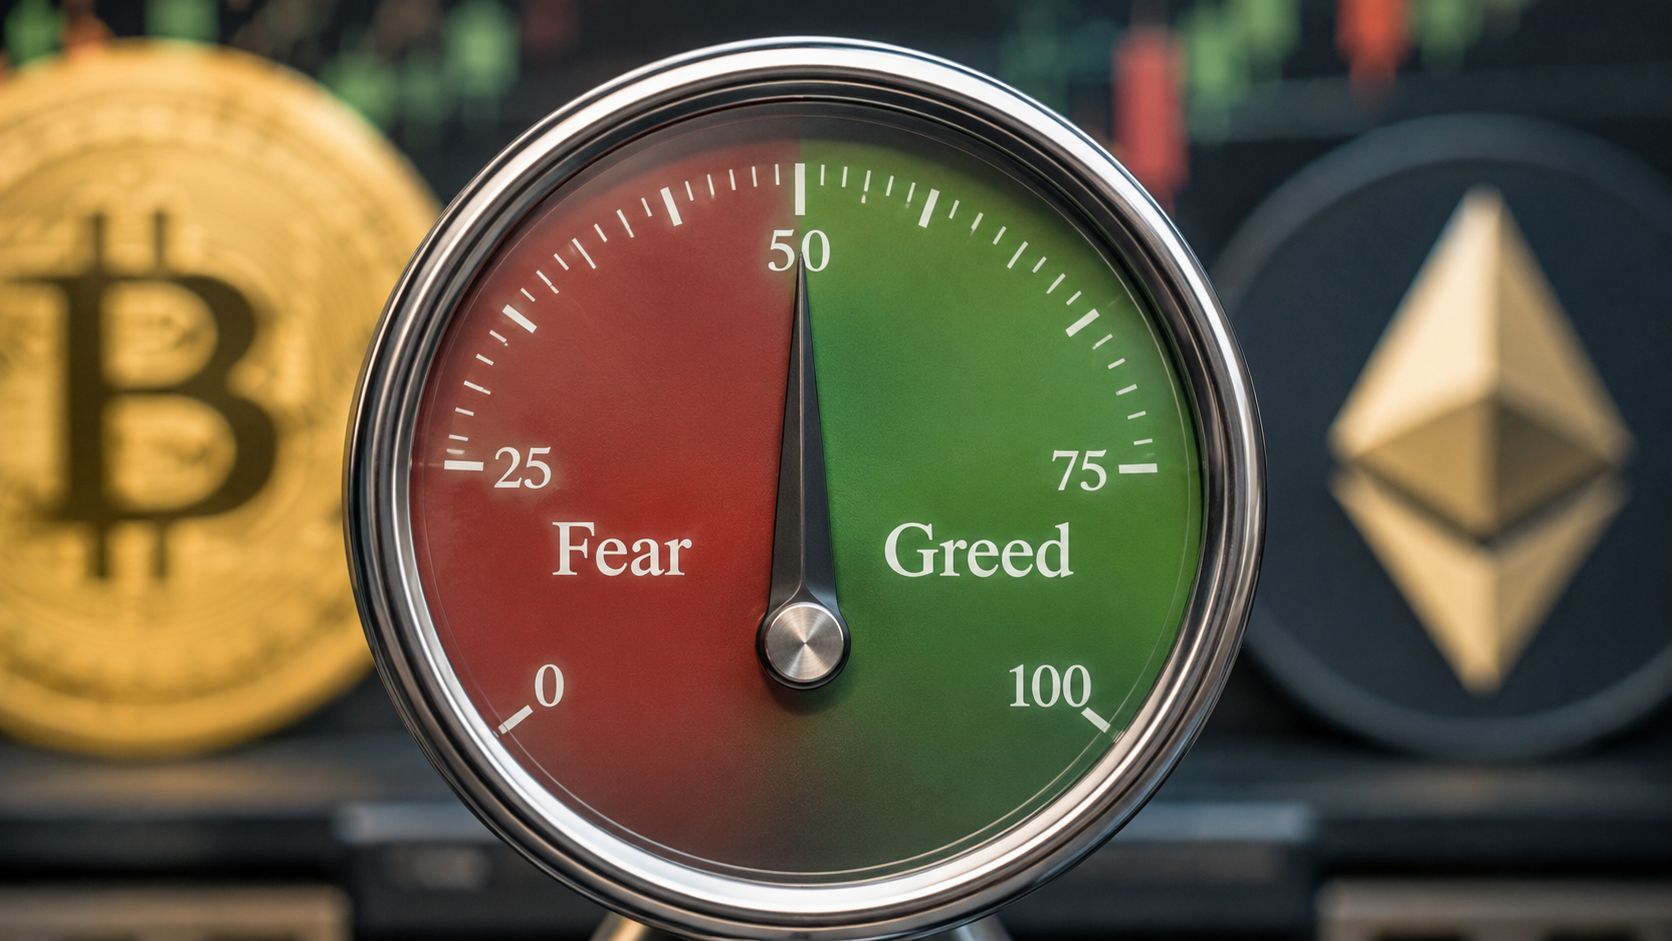
The Crypto Fear and Greed Index is a 0–100 sentiment gauge that measures whether crypto market participants are driven by fear, shown by lower scores, or greed, shown by higher scores. It combines volatility, market momentum and volume, social media activity, Bitcoin dominance, and Google Trends data into one market-mood reading.
You've probably checked Bitcoin's chart after a sudden move and felt caught between three choices: buy the dip, sell before the decline gets worse, or do nothing. Price tells you what has happened, but it doesn't always show why traders are behaving that way. The Fear and Greed Index adds a behavioral layer by showing whether anxiety or optimism dominates the market.
That distinction matters. A fearful reading can appear while Bitcoin remains stable, and a greedy reading can persist while prices continue climbing. The index is best treated as a behavioral thermometer, not a crystal ball. It can help you recognize crowded emotions, but it can't tell you exactly where Bitcoin, Ethereum, an altcoin, or a DeFi token will move next.
Table of Contents
- Understanding the Fear and Greed Index in Crypto Markets
- How the Crypto Fear and Greed Index Is Calculated
- Stock Market Origins Versus the Crypto Adaptation
- Reading the Score Bands and Applying Them to Trading
- Limitations and When the Index Misleads
- Building a Complete Sentiment Analysis Toolkit
- Key Takeaways for Smarter Crypto Decisions
Understanding the Fear and Greed Index in Crypto Markets
The crypto Fear and Greed Index turns a messy collection of market signals into a single score from 0 to 100. A score near 0 represents extreme fear, while a score near 100 represents extreme greed. The Alternative.me Crypto Fear and Greed Index describes its original version as a daily Bitcoin-centered sentiment score, so readers shouldn't mistake it for a complete measurement of every corner of crypto.
Why sentiment matters
Crypto markets react quickly to changing expectations. Traders may rush to sell when they fear a collapse, even if a project's smart contracts still work and its tokenomics haven't changed. During a rally, FOMO can encourage buyers to chase rising prices before they've examined liquidity, valuation, network activity, or the risks surrounding a Web3 application.
The index doesn't measure an individual trader's emotions. It aggregates market behavior through several signals, including price volatility, momentum, trading activity, social discussion, Bitcoin's market share, and search interest. That makes it useful for answering a narrow question: what mood is visible across the market right now?
Practical rule: Use the index to question your emotional reaction, not to outsource your decision.
A fearful reading may tell you that market participants are defensive. It doesn't prove that an asset is undervalued. A greedy reading may show strong enthusiasm, but it doesn't prove that a reversal is imminent. Your next step still requires separate research into price structure, liquidity, fundamentals, custody, and risk.
A Bitcoin-centered market signal
The index is widely discussed as if it represents the entire digital-asset economy. In practice, its design is strongly connected to Bitcoin. That bias makes sense because Bitcoin often influences broad crypto sentiment, but it creates problems for readers focused on Ethereum, Layer 2 networks, NFTs, or a specific DeFi protocol.
For example, a calm Bitcoin market can coexist with stress in a lending protocol, weakening activity on a Layer 2 network, or enthusiasm around real-world asset tokenization. The index may not capture those sector-level differences. Start with the score as a broad mood reference, then narrow your analysis to the asset or ecosystem you're considering.
How the Crypto Fear and Greed Index Is Calculated
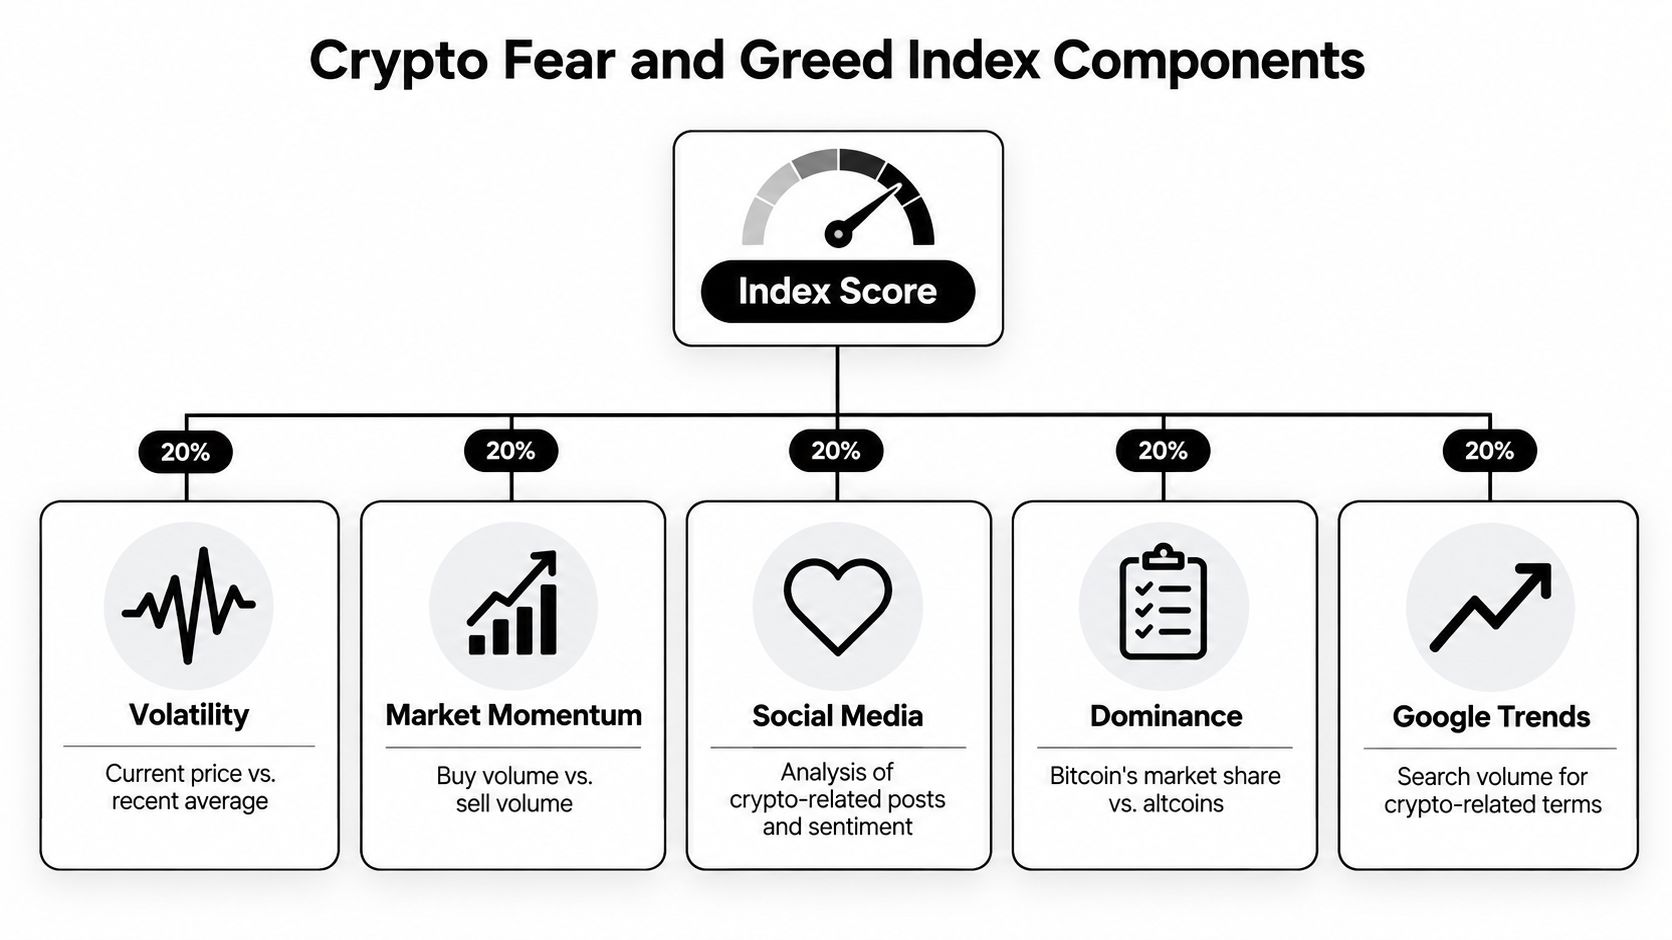
The crypto index combines five inputs to estimate market mood. It gives the largest individual weights to volatility and market momentum, while social activity and search behavior add clues about crowd attention.
According to CoinMarketCap's explanation of the index, the components are weighted as follows:
- Volatility, 25%: This compares current market turbulence with recent behavior. A sudden rise often appears during panic, although a sharp rally can also create unstable conditions. Volatility can therefore support a fearful reading even while price is climbing.
- Market momentum and volume, 25%: This measures the strength of recent price movement alongside trading activity. Rising prices with heavy volume can move the reading toward greed. Weak momentum or declining participation can pull it toward fear, even if price has not fallen sharply.
- Social media activity, 15%: The index tracks activity and sentiment in crypto discussions. A surge of enthusiastic Bitcoin posts during a rally may support greed, while negative conversation may support fear. Social attention shows crowd temperature, not the direction of the next move.
- Bitcoin dominance, 10%: This measures Bitcoin's share of the wider crypto market. Rising dominance may reflect defensive positioning or a shift toward the largest crypto asset. It can also occur for other reasons, so the same reading may mean different things in different market conditions.
- Google Trends, 10%: Search activity measures attention around Bitcoin and crypto-related terms. More searches indicate that interest is increasing, but they do not show whether people plan to buy, sell, or merely investigate a market move.
Why the weighting changes interpretation
Volatility and momentum together account for half of the score. Social activity, Bitcoin dominance, and search trends supply the other half. The result responds strongly to market behavior and Bitcoin-related conditions, so it can diverge from the price of a particular altcoin or from conditions in a specific crypto sector.
The inputs are compared with recent baselines, rather than judged only by absolute price levels, as described in CoinMarketCap's Fear and Greed Index data overview. Bitcoin can trade at a high price and still show fear if recent moves become unstable or participants turn defensive. A lower-priced asset can show greed when momentum, participation, and attention improve against their recent levels.
The score is a sentiment gauge, not a valuation model. It cannot determine whether Bitcoin is cheap in dollar terms, whether Ethereum's fees are attractive, or whether a token's circulating supply supports a reasonable market capitalization. It describes how current behavior compares with the market's recent emotional baseline. Price action can confirm that signal, or expose a divergence that demands closer analysis.
Stock Market Origins Versus the Crypto Adaptation
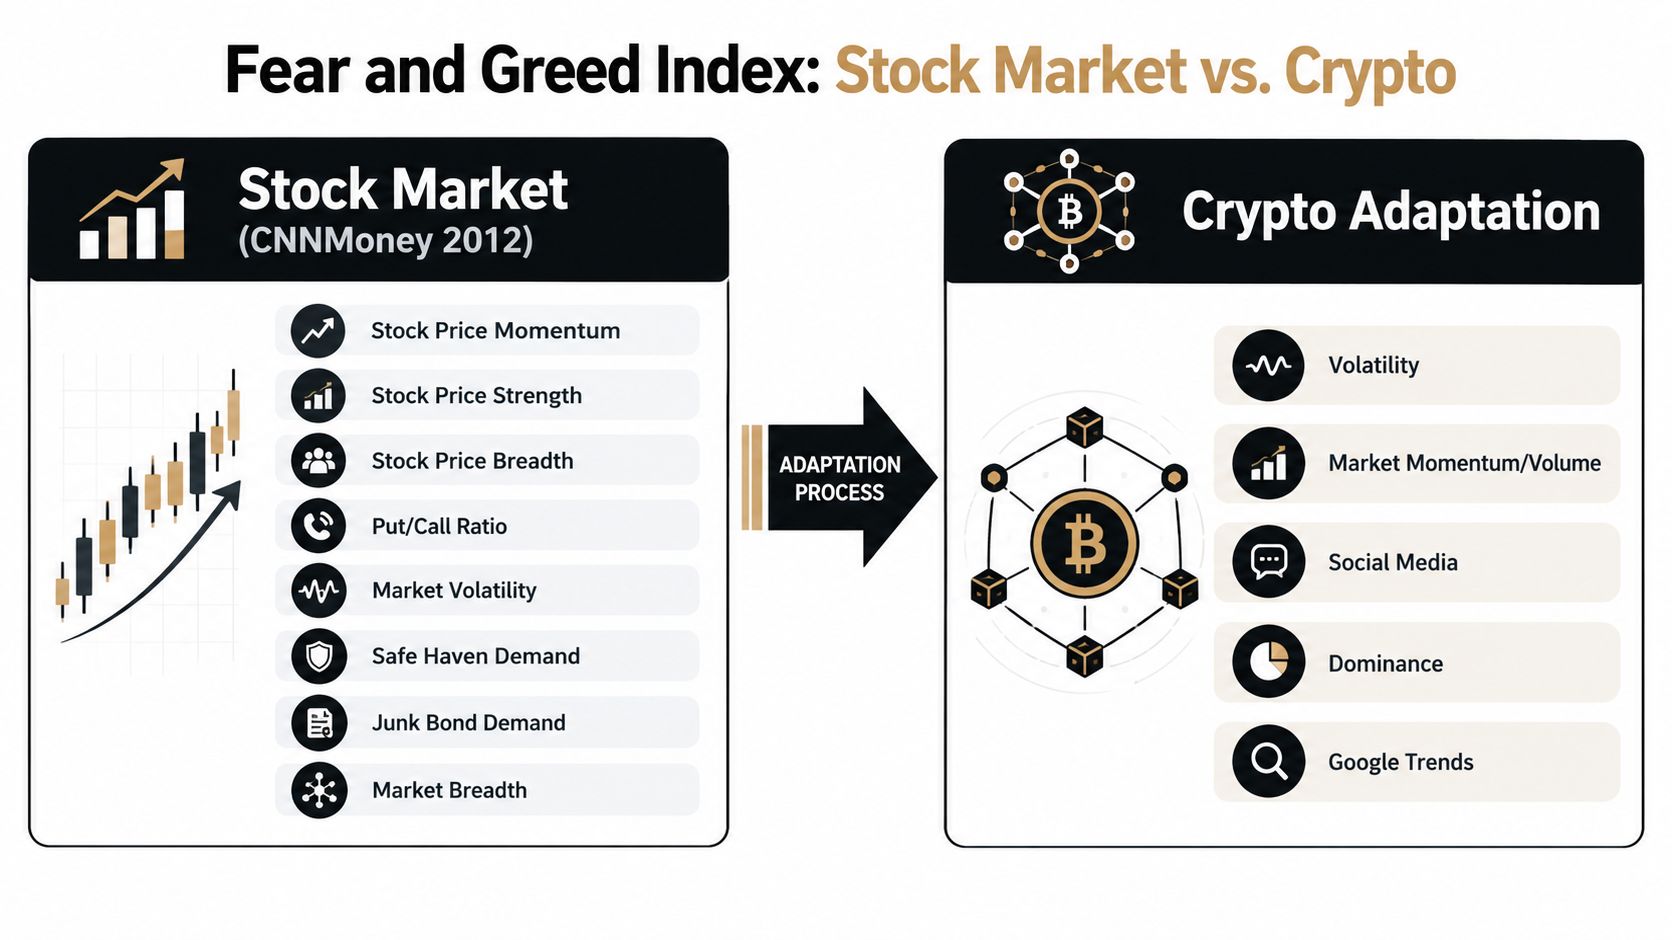
The broader Fear and Greed concept began in traditional finance. CNNMoney introduced its original Fear & Greed Index in spring 2012, after the 2008 financial crisis and the European debt crisis, according to this historical account of the index's development. The stock-market version was designed to summarize investor behavior in equities through signals associated with market breadth, volatility, options positioning, safe-haven demand, and demand for riskier bonds.
Crypto required a different adaptation because digital assets produce different types of observable market behavior. Social media activity is unusually important in crypto, Bitcoin dominance offers a market-specific rotation signal, and Google search interest can change quickly during a token narrative or market shock. The crypto version therefore uses volatility, momentum and volume, social media, Bitcoin dominance, and Google Trends.
The important structural difference
The stock-market index is intended to describe sentiment across a diversified equity market. The crypto version is much more Bitcoin-centered. That distinction affects how you should use it.
A stock investor may use a broad equity sentiment gauge as context for a portfolio containing many companies and sectors. An altcoin trader faces a different problem. Sentiment around a Layer 2 network, DeFi protocol, gaming token, or AI-and-crypto project can diverge from Bitcoin's mood because those assets have their own liquidity, governance, development, and adoption risks.
What historical extremes show
The index family can capture sharp changes in market mood. One historical series lists an extreme-fear reading of 3 on April 8, 2025, and an extreme-greed reading of 83 on December 19, 2023, as reported in the LBank historical overview linked above. Those observations illustrate the range of the 0–100 scale and the fact that sentiment can reverse dramatically.
They don't establish a guaranteed trading pattern. An extreme reading can mark a crowded emotional state, but it doesn't tell you whether the crowd will reverse immediately, remain positioned in the same direction, or respond to a new event. The adaptation is useful because it reflects crypto-native behavior, but its Bitcoin bias remains part of the tool's design.
Reading the Score Bands and Applying Them to Trading
The score bands offer a shared vocabulary for market mood, but they are not a trading signal by themselves. Read them like a dashboard light: useful for identifying a change in conditions, yet insufficient for diagnosing the entire vehicle. The scale runs from extreme fear at 0 to extreme greed at 100.
| Score Range | Sentiment Zone | Market Implication | Suggested Action |
|---|---|---|---|
| 0–24 | Extreme Fear | Defensive behavior and strong pessimism dominate | Slow down, review risk, and research quality assets |
| 25–49 | Fear | Caution is widespread and buying pressure may be fragile | Check liquidity, price structure, and your investment thesis |
| 50 | Neutral | Fear and greed are relatively balanced | Wait for stronger confirmation rather than forcing a trade |
| 51–74 | Greed | Optimism and risk-taking are becoming more visible | Review exposure and avoid chasing extended moves |
| 75–100 | Extreme Greed | Confidence may be crowded and speculative | Stress-test your plan and consider whether risk is excessive |
Use each band as a question
Extreme fear does not automatically mean an attractive entry. Ask whether the asset has a credible reason to recover, whether liquidity is adequate, and whether the fear reflects a temporary shock or a deeper failure. A Bitcoin trader can compare the reading with price structure and on-chain activity. For Ethereum or a DeFi token, network usage, protocol health, governance risks, and token supply dynamics may matter more.
The relationship between the score and price deserves particular attention. If fear rises while price continues falling, sentiment confirms weak momentum, but it may also show that selling is becoming crowded. If fear remains high while price stabilizes, the divergence can suggest that sellers are losing force, though it does not confirm a reversal. The index becomes more useful when it agrees with market structure, and more misleading when the two move in opposite directions.
Neutral readings often reflect indecision or consolidation. That can support a plan to wait for a breakout, but quiet conditions should not create a trade where no clear setup exists.
Greed and extreme greed call for discipline, not automatic selling. A strong trend can continue while optimism grows. Review position size, concentration, and the assumptions behind your thesis instead of trying to identify the exact top.
A restrained workflow
- Record the score and direction: Note whether sentiment is becoming more fearful, more optimistic, or stable.
- Compare it with price: Identify agreement or divergence between mood, trend, support, and resistance.
- Check the asset's own data: Review on-chain activity, exchange liquidity, DeFi total value locked, or protocol developments where relevant.
- Define the action before acting: Choose whether to research, add gradually, reduce risk, or wait.
- Protect against emotional overrides: A written plan is more useful than a dramatic headline.
For broader trading principles, this guide to crypto trading strategies can complement sentiment analysis. Treat the index as a contrarian checkpoint, not a standalone entry or exit signal.
Limitations and When the Index Misleads
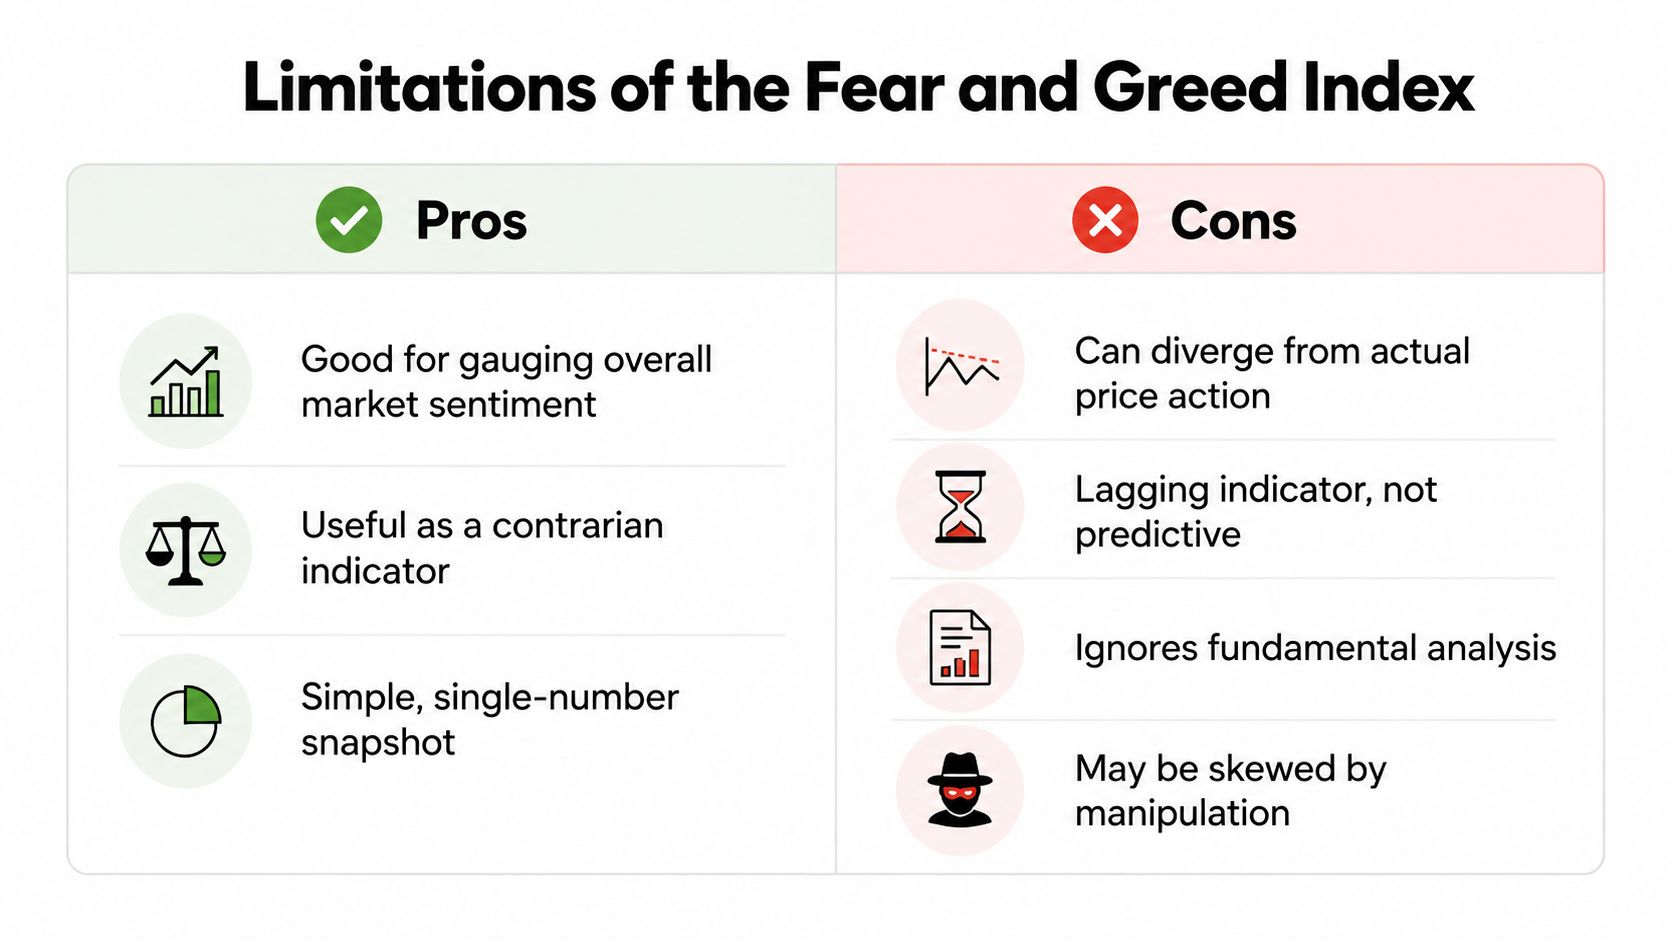
The biggest mistake is assuming that sentiment must follow price in a clean, immediate way. It doesn't. A market can stabilize while participants remain anxious, or price can hold firm while the index becomes more optimistic because volatility, momentum, social activity, dominance, and search interest have shifted.
A useful example comes from Q2 2025. CoinMarketCap reported that the index moved from 24, classified as Fear, to above 75, classified as Greed, and then back toward Neutral around 49 by quarter-end, while Bitcoin held near $107K, according to the research paper discussing this sentiment and price divergence. The reading reset without a matching collapse in Bitcoin's price.
Why divergence happens
The index responds to changes in market behavior relative to recent conditions. If volatility cools, activity changes, or attention fades, sentiment can move even when the headline price remains relatively stable. That makes the index useful for detecting a change in mood, but unreliable as a direct statement about fair value.
The broader market regime matters too. Market reviews cited in the same research report described lower Bitcoin realized volatility in different 2025 periods, with figures around 29% to 43%, as linked in the research source above. In a calmer regime, a fear reading may carry a different meaning than it did during a boom-and-bust cycle with much sharper price swings.
A fearful score can describe hesitation, not necessarily an imminent sell-off.
The Bitcoin bias and data quality problem
The index can't provide a detailed read on every asset. It may be a poor proxy for:
- Altcoin-specific sentiment: A token can face a project-level crisis while Bitcoin sentiment remains steady.
- Layer 2 health: Throughput, fees, bridge security, and developer activity require ecosystem-specific analysis.
- DeFi conditions: Lending demand, liquidation risk, protocol revenue, and total value locked aren't fully represented by a broad Bitcoin-centered score.
- Tokenized assets: Real-world asset projects have legal, counterparty, and settlement considerations that sentiment data can't replace.
Social data introduces another weakness. Bots, coordinated campaigns, and repeated posts can increase visible activity without representing genuine buying interest. Daily readings can also lag fast-moving events, while a market can continue trending after sentiment reaches an extreme.
Readers studying a prolonged downturn can use this crypto bear market guide for broader context. The index may help describe the mood, but it doesn't replace technical analysis, fundamental research, or a defined risk plan.
Building a Complete Sentiment Analysis Toolkit
A stronger process combines the index with evidence from different parts of the market. The aim isn't to collect every dashboard available. It's to compare signals that measure different behaviors and identify where they agree or conflict.
Start with market positioning
Funding rates on perpetual futures can show whether traders are paying to maintain long or short exposure. Exchange inflows and outflows can provide context about potential selling or withdrawal behavior, although neither metric gives a complete explanation by itself. Whale-wallet tracking may reveal large-holder movements, but wallet labels and transaction motives require careful interpretation.
On-chain data can also help you test a sentiment reading. If the index shows extreme fear while large holders appear to accumulate and exchange balances decline, the divergence may deserve research. It still isn't proof of a bottom. The same movement could reflect custody changes, internal transfers, or incomplete data.
Add sector-specific context
DeFi total value locked can help you assess whether activity is expanding or contracting across protocols. For Ethereum and Layer 2 networks, examine transaction activity, fees, bridge flows, developer progress, and smart-contract security. For an AI-and-crypto project, investigate whether the token's demand connects to actual product usage rather than narrative-driven attention.
Altcoin traders should also seek dashboards that isolate sector sentiment instead of relying only on a Bitcoin-centered composite. A gaming token, real-world asset protocol, and decentralized exchange can respond to different catalysts even during the same market session.
For a broader explanation of how sentiment fits into decision-making, this trader's guide to market sentiment offers useful conceptual context. You can then apply those ideas through a practical market sentiment analysis framework.
A simple signal matrix
| Index Reading | Confirming Evidence | Conflicting Evidence | Response |
|---|---|---|---|
| Fear | Weak price, rising selling pressure, deteriorating activity | Stable price and signs of accumulation | Research carefully, don't rush |
| Greed | Strong price and broad participation | Excessive leverage or narrowing participation | Review risk and avoid chasing |
| Neutral | Clear trend forming elsewhere | Mixed data across sectors | Wait for confirmation |
This layered approach works across Bitcoin, Ethereum, Web3 applications, DeFi, and tokenized assets because it separates market mood from market condition. The index supplies the mood. Your toolkit supplies the context.
Key Takeaways for Smarter Crypto Decisions
The answer to “what is fear and greed index” is straightforward: it's a 0–100 composite gauge of crypto market sentiment, with lower readings associated with fear and higher readings associated with greed. Its value comes from organizing scattered behavioral signals into a quick reference point.
Use it with a short checklist:
- Check the reading and its direction: A single score matters less than whether sentiment is changing.
- Compare mood with price: Stable Bitcoin prices during a sharp sentiment shift may signal a reset rather than a trend reversal.
- Treat extremes as research triggers: Extreme fear can prompt careful investigation, while extreme greed can prompt a portfolio-risk review.
- Verify the asset separately: Ethereum, altcoins, Layer 2 networks, DeFi protocols, and tokenized assets need their own data.
- Avoid automatic rules: “Buy fear, sell greed” is a slogan, not a complete strategy.
- Keep risk controls active: Position size, liquidity, and time horizon still matter.
The index is most useful when it makes you slower and more deliberate. Check a reliable source, write down what the score suggests, identify the evidence that could contradict it, and only then decide whether your plan calls for action.
Coiner Blog publishes practical crypto education and analysis covering Bitcoin, Ethereum, DeFi, Web3, tokenomics, Layer 2 networks, AI and crypto, and emerging blockchain sectors. Visit Coiner Blog to follow grounded guides that connect market sentiment with the risks and mechanics behind digital assets.