
Funding Rate Crypto: A Practical Guide for 2026

You check your phone after a quiet night and see a funding charge on your Bitcoin perpetual position. The price barely moved, yet your balance changed. That small line item is easy to ignore, but it can reveal how aggressively traders are positioned, which venue is carrying the most exposure, and whether a market-neutral trade is being paid or charged to stay open.
Funding rates sit at the center of perpetual futures trading. They affect Bitcoin and Ethereum positions, cash-and-carry trades, cross-exchange arbitrage, and the way traders interpret market stress. The familiar explanation, “longs pay shorts,” is useful, but incomplete. In real markets, funding can diverge sharply across venues, turn negative during forced selling, and create risks that a simple directional sentiment reading misses.
Table of Contents
- What Funding Rate Crypto Actually Means
- The Funding Formula in Plain Language
- Why Funding Rates Exist and How They Move Markets
- Arbitrage and Hedging Strategies Built on Funding
- How to Monitor Funding Rates Across Exchanges
- When Funding Goes Negative and What It Signals
- Risks and Best Practices Before You Trade the Funding
What Funding Rate Crypto Actually Means
The trader in our opening example may have expected a negative charge because the position was short. Instead, a negative funding rate can mean shorts pay longs, so a long BTC perpetual position may receive a payment. The direction depends on the rate displayed by the exchange at the settlement time, not on whether the trader feels bullish or bearish.
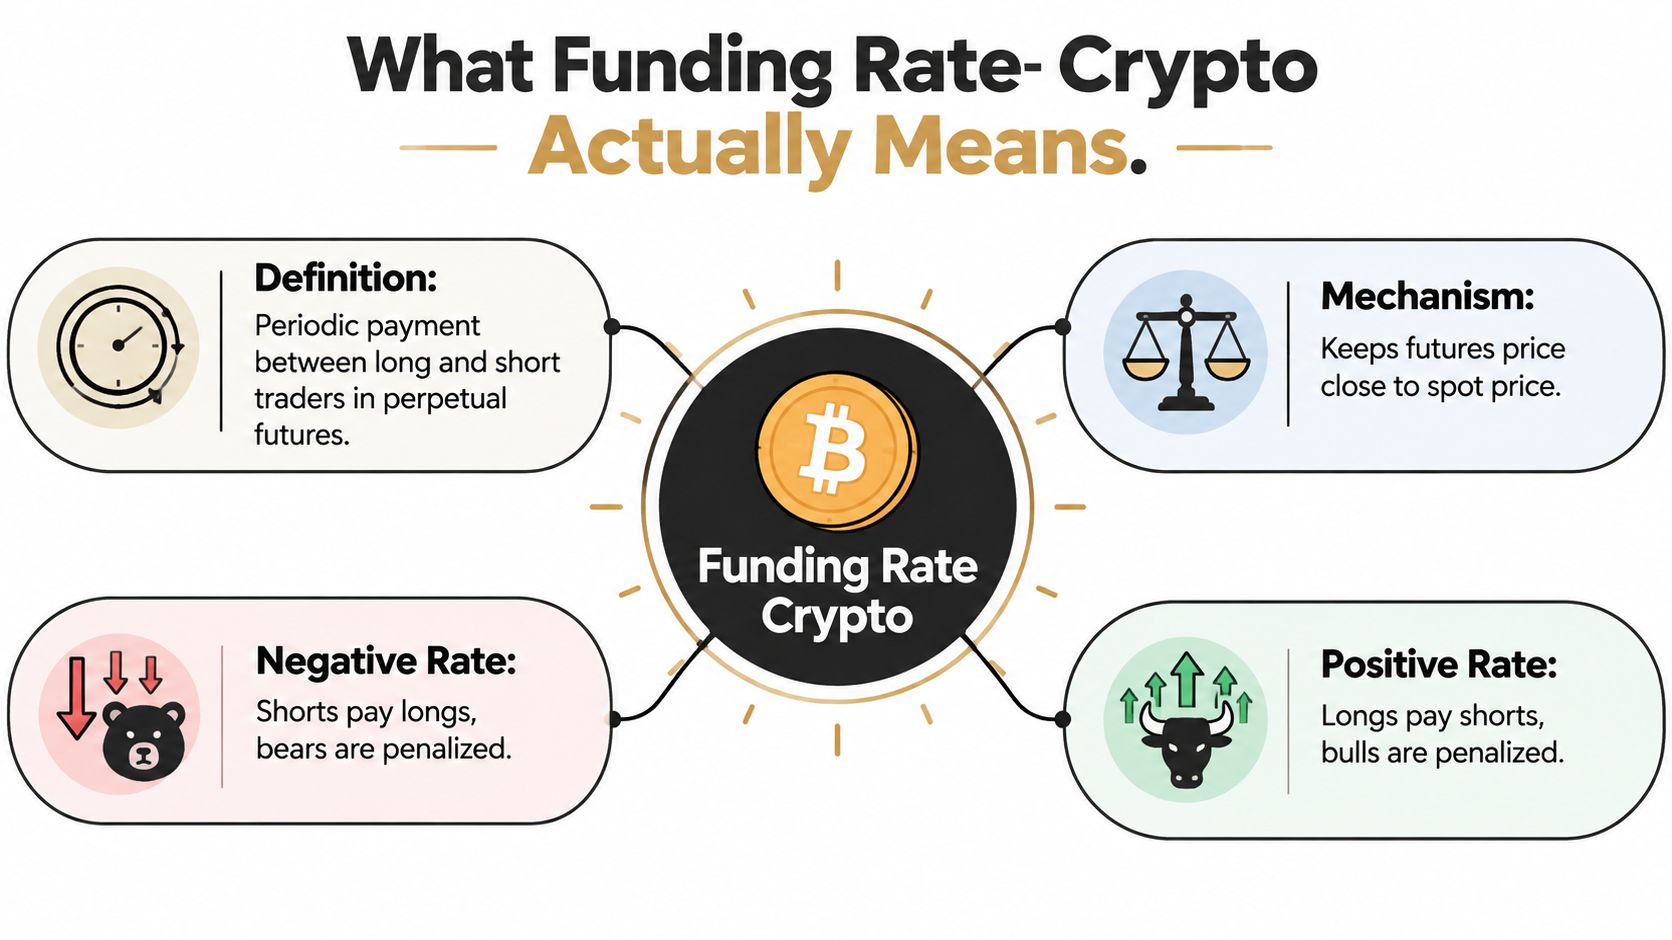
A crypto funding rate is a periodic transfer between long and short holders of a perpetual futures contract. Its purpose is to keep the perpetual price close to the underlying spot market. Academic research describes funding as an adjustment mechanism that is typically paid every eight hours and approximates the average futures-to-spot spread over the preceding interval, helping pull the contract back toward spot price (academic research on perpetual futures funding).
Unlike a quarterly futures contract, a perpetual has no expiration date. A dated future can converge toward spot as its settlement date approaches. A perpetual needs another mechanism to create that pressure, and funding supplies it. If the perpetual trades above spot, longs generally pay shorts, which makes holding the expensive long side less attractive. If it trades below spot, shorts generally pay longs, encouraging demand for the discounted contract.
The payment is not an exchange commission
Funding usually moves between traders rather than going to the exchange as a conventional trading fee. Settlement intervals vary by venue and contract. Many major crypto venues use an eight-hour schedule, commonly listed as 00:00, 08:00, and 16:00 UTC, while some contracts use other intervals. OKX explains that its default perpetual funding fee is charged or paid every eight hours unless a different interval applies (OKX funding fee mechanism).
The quoted rate can also confuse new traders. An exchange may show an annualized figure, but the actual debit or credit applies only to the relevant funding interval. A displayed annualized rate isn't the amount deducted from your position every eight hours.
For a deeper introduction to the contract itself, see this guide to what perpetual futures are. The important shift is to stop treating funding as background noise. It is a live price for risk, and differences in that price can become a signal, a hedge cost, or the foundation of an arbitrage trade.
The Funding Formula in Plain Language
The formula looks intimidating because exchanges combine a premium measure with an interest component, then apply rules that limit abrupt changes. Separate those parts, and the calculation becomes easier to follow.
Start with the premium
The premium index measures the gap between a perpetual contract and its spot reference. A positive premium means the perpetual trades above spot. A negative premium means it trades below spot.
Binance describes its funding calculation as an average premium index combined with an interest-rate differential and subject to a clamp. Its Futures default interest component is 0.03% per day, or 0.01% per eight-hour interval, because funding is commonly calculated three times daily (Binance funding rate formula).
In simplified form:
Funding rate = premium component + adjusted interest-rate component
The clamp stops a temporary premium or discount from becoming an uncontrolled funding payment. Exchanges also average the inputs across the interval, so the displayed rate reflects more than one isolated trade or a sudden order-book move.
A worked example, with an important limitation
Suppose a BTC perpetual trades 0.4% above spot. A simple average-spread calculation across an eight-hour interval would imply roughly 0.05% per interval, before the venue applies its exact formula and clamp. If that rate continued, it would equal approximately 54% annualized, using the example's base-rate assumption.
The arithmetic shows how quickly a carrying cost can become significant. It does not guarantee that an exchange will display that exact figure. Mark prices, index prices, premium averages, caps, floors, and contract-specific rules can all change the result.
| Asset | Mark vs Spot | Premium Index | Base Rate | 8h Funding Rate | Annualized | Direction |
|---|---|---|---|---|---|---|
| BTC | Above spot | Positive | Positive interest component | Positive in the simplified case | Can become costly when sustained | Longs pay shorts |
| ETH | Below spot | Negative | Positive interest component may be outweighed | Negative in a sufficiently weak perp market | Can benefit longs when sustained | Shorts pay longs |
Why the sign matters
If ETH spot demand rises while perpetual traders do not add comparable long exposure, the contract can trade at a discount to spot. The premium component becomes negative, and the final funding rate may also turn negative. Shorts then pay longs, which can encourage traders to buy the perpetual or close short positions.
That payment flow does not guarantee a rally. It identifies who is paying to maintain exposure, while price risk, liquidation risk, and future funding changes remain. Funding is arithmetic first, interpretation second, and the same sign can carry different meaning across venues with different order books and trader populations. A negative reading may signal weakness, or it may show that short positioning has become crowded enough to create a contrarian setup.
Why Funding Rates Exist and How They Move Markets
A perpetual contract has no expiry date forcing its price back toward spot. Without funding, traders could hold that derivative indefinitely while its price remained detached. Arbitrageurs might still buy the cheaper instrument and sell the more expensive one, but funding turns that pressure into a recurring transfer rather than a trade based only on expected convergence.
Positive funding increases the carrying cost of long positions. Traders with oversized longs may reduce exposure, add collateral, or shift toward spot. Negative funding reverses the payment direction mechanically. A trader holding a long perpetual may receive payments from shorts, while still facing price losses, liquidation, and future rate changes.
Practical rule: Funding identifies who pays to maintain exposure. It does not predict who will be right about price.
One asset, several funding markets
BTC does not have one universal funding rate. Binance, OKX, Bybit, and decentralized venues use different order books, indices, margin systems, trader groups, and settlement rules. A rate shown by one exchange can therefore give a misleading view of the broader market.
A BitMEX Research report found that from 2023 to 2026, Hyperliquid Bitcoin perpetuals paid an average annualized funding premium of +7.17% versus Binance, while Ether perpetuals averaged about +5.31% more than Binance. It also reported that Hyperliquid BTC funding stayed positive 95% of the time, with standalone Bitcoin funding near 14.6%, compared with roughly 7.4% on Binance (historical funding-rate comparison).
That 7%+ Hyperliquid versus Binance gap changed how traders viewed funding in 2026. It was not a stronger bullish signal. Separate liquidity pools, trader mixes, collateral preferences, and liquidation behavior can produce different rates for the same asset. Comparing TradingList crypto short ratio watchlists with funding can clarify positioning, but a short ratio and a funding rate measure different things.
Cross-venue spreads narrowed in the first half of 2026 to roughly 1.5 to 2.0 basis points per eight-hour interval, down from about 2.8 to 3.4 basis points in late 2025, although sharp divergences still appeared (cross-venue funding divergence analysis). The spread can therefore become an arbitrage signal, but only after considering fees, transfers, collateral, and execution.
Negative funding also deserves a second reading. It may show genuine weakness, yet it can signal crowded shorts and create contrarian conditions. Funding shows the cost of positioning, not the direction price must take.
Arbitrage and Hedging Strategies Built on Funding
Funding trades resemble interest carry, but the payment is only one part of the position. Execution, collateral, liquidity, borrowing, and counterparty exposure can determine whether the trade works. The practical test is simple: does expected funding income exceed the costs of keeping both legs open?
Cash-and-carry
The standard structure pairs long spot and short the perpetual. With positive funding, short-perpetual traders may receive payments while the spot position offsets much of the asset's price exposure. A perpetual trading above spot can also offer basis income if that gap later narrows.
Suppose a $100,000 notional position receives 0.03% every eight hours. The payment is $30 per interval. If the same rate continued across a month, the illustrative total would be $2,700 before fees. This is a scenario based on the stated assumptions, not a forecast. Funding changes with positioning and market conditions.
The hedge reduces directional risk without removing operational risk. Basis can widen, the short perpetual leg can approach liquidation, an exchange can fail, and execution slippage can reduce or erase the carry.
Reverse cash-and-carry
The reverse structure shorts spot, usually by borrowing the asset, and goes long the perpetual. It can receive negative funding when short traders pay long traders. Borrowing costs then become part of the calculation. If the asset becomes difficult to borrow, the rate can rise, the lender can recall the position, or the spot short can become unavailable.
Negative funding may reflect forced short positioning rather than a lasting collapse in demand. That setup can offer attractive carry, but the trade may deteriorate quickly if funding turns positive before the position is closed. A trader must price the borrow and exit conditions before treating the displayed funding rate as income.
Cross-exchange arbitrage
A cross-venue trade holds opposing perpetual positions, short where the rate makes long exposure expensive and long where the rate is relatively cheap. The aim is to reduce price direction and collect the difference between venues. This is a form of crypto arbitrage trading, but the hedge is only as reliable as the two markets' execution and margin systems.
The +7.17% annualized Hyperliquid versus Binance Bitcoin premium reported for the 2023 to 2026 period shows why venue selection became important. The gap of more than 7% reshaped arbitrage in 2026, yet it was not free yield. Funding can converge before settlement, mark prices can differ, and the venue offering the richer rate may become less liquid when traders rush into the spread.
The same asset can therefore carry different funding across exchanges. Trader composition, collateral preferences, liquidation flows, and liquidity pools all influence the rate. A negative reading can even become a contrarian clue when shorts are crowded, though funding alone does not predict the next price move.
| Strategy | When Profitable | Capital Required | Hold Period | Primary Risk |
|---|---|---|---|---|
| Cash-and-carry | Positive perp funding and manageable basis | Spot capital plus perp margin | Until funding or basis weakens | Basis widening or perp liquidation |
| Reverse cash-and-carry | Negative funding exceeds borrow and trading costs | Borrowable spot plus perp margin | Until the rate normalizes | Borrow recall, rising borrow cost, price squeeze |
| Cross-exchange arbitrage | Venue spread exceeds fees, slippage, and transfer friction | Margin on both venues | Often tied to spread behavior | Counterparty, mark-price, and settlement mismatch |
How to Monitor Funding Rates Across Exchanges
A useful dashboard starts with a narrow watchlist. Choose the asset, contract, and venues first. Then record the current rate, next-funding countdown, mark price, index price, open interest, and recent funding history. A single reading can be noisy, while a time series shows whether traders are repeatedly paying for the same side.
A practical monitoring routine
- Choose comparable contracts. Confirm that BTCUSDT on one venue uses the same settlement convention and quote currency as the contract on another venue.
- Check the interval. Funding may be exchanged every eight hours on major venues, but a different contract can use another schedule. The interval changes the meaning of a displayed rate.
- Set a meaningful alert. A threshold such as ±0.05% per eight hours can flag an unusually expensive side in a personal monitoring workflow, but it isn't a universal trading signal.
- Track persistence. Review the seven-day annualized rate rather than reacting to one live print.
- Compare source feeds. Aggregators can lag, normalize, or calculate annualized figures differently from the exchange interface.
Where each platform fits
| Platform | Best For | Key Feature |
|---|---|---|
| Binance | High-liquidity major perpetuals | Native funding history and contract details |
| Bybit | Perpetual market monitoring | Exchange-level rate and countdown displays |
| OKX | Settlement-rule verification | Clear funding-fee documentation |
| dYdX | Decentralized derivatives context | On-chain trading environment |
| Hyperliquid | Venue-specific funding divergence | Distinct liquidity and trader positioning |
| CoinGlass | Broad market comparison | Aggregated funding and derivatives dashboards |
| Laevitas | Quantitative derivatives research | Cross-market analytics and historical views |
Handling negative readings correctly
The interface direction matters. A negative number generally means shorts pay longs, but the exact debit or credit depends on the exchange's position convention and contract documentation. Don't assume that a red number always means “bearish opportunity.”
A simple workflow can use a spreadsheet with columns for timestamp, venue, pair, funding rate, annualized rate, and next settlement. For automated alerts, a trader can pull exchange data into a spreadsheet or send a Telegram notification when the BTC spread between Binance and Hyperliquid exceeds a chosen threshold. The alert should prompt verification, not automatic execution.
A price index can help with asset context, but it shouldn't replace derivatives-specific feeds. Even a broad World Coin Index resource won't answer whether two perpetual contracts share the same settlement mechanics.
When Funding Goes Negative and What It Signals
The cliché that funding equals sentiment breaks down because funding measures the price of crowded positioning, not pure directional conviction. Persistent negative funding means shorts are paying longs, but that can reflect aggressive hedging, basis trades, liquidation pressure, or a shortage of long exposure rather than a confident bullish view.
The most useful interpretation is conditional. Negative funding says that holding the long side receives a payment under the relevant contract rules. It doesn't say that spot buyers have taken control, that a short squeeze must follow, or that the asset has found a bottom.
Why depressed funding deserves attention
Recent February 2026 data placed funding rates in the bottom 3% to 15% of historical monthly readings across major tokens. The same data showed SOL on Hyperliquid at an annualized -18.33% and BTC on Binance at -0.68% annualized, while broader dashboards displayed near-zero or negative readings for some assets (February 2026 funding-rate data).
Those figures create several possible narratives. A liquidation cascade can push funding negative briefly as shorts and distressed longs reposition. A structural negative can persist when traders use the perpetual as a hedge or when the spot market carries stronger demand than the derivatives market.
The distinction matters more than the sign itself.
Read the rate with other positioning data
A negative rate accompanied by falling open interest may indicate that risk is leaving the market. A negative rate with rising open interest may show that traders are building a crowded short book. Liquidations, basis, spot volume, and venue differences help separate those conditions.
One negative print is an observation. A repeated negative regime is a positioning question.
Traders face three common traps. They short into a squeeze because the asset “looks weak,” ignore a spot-driven move that leaves perps cheap, or treat a temporary rate caused by forced selling as a durable trend. Negative funding can support a contrarian or mean-reversion thesis, but it can also be compensation for owning an asset during severe market stress. The payment is real, yet it may be too small to offset the price risk.
Risks and Best Practices Before You Trade the Funding
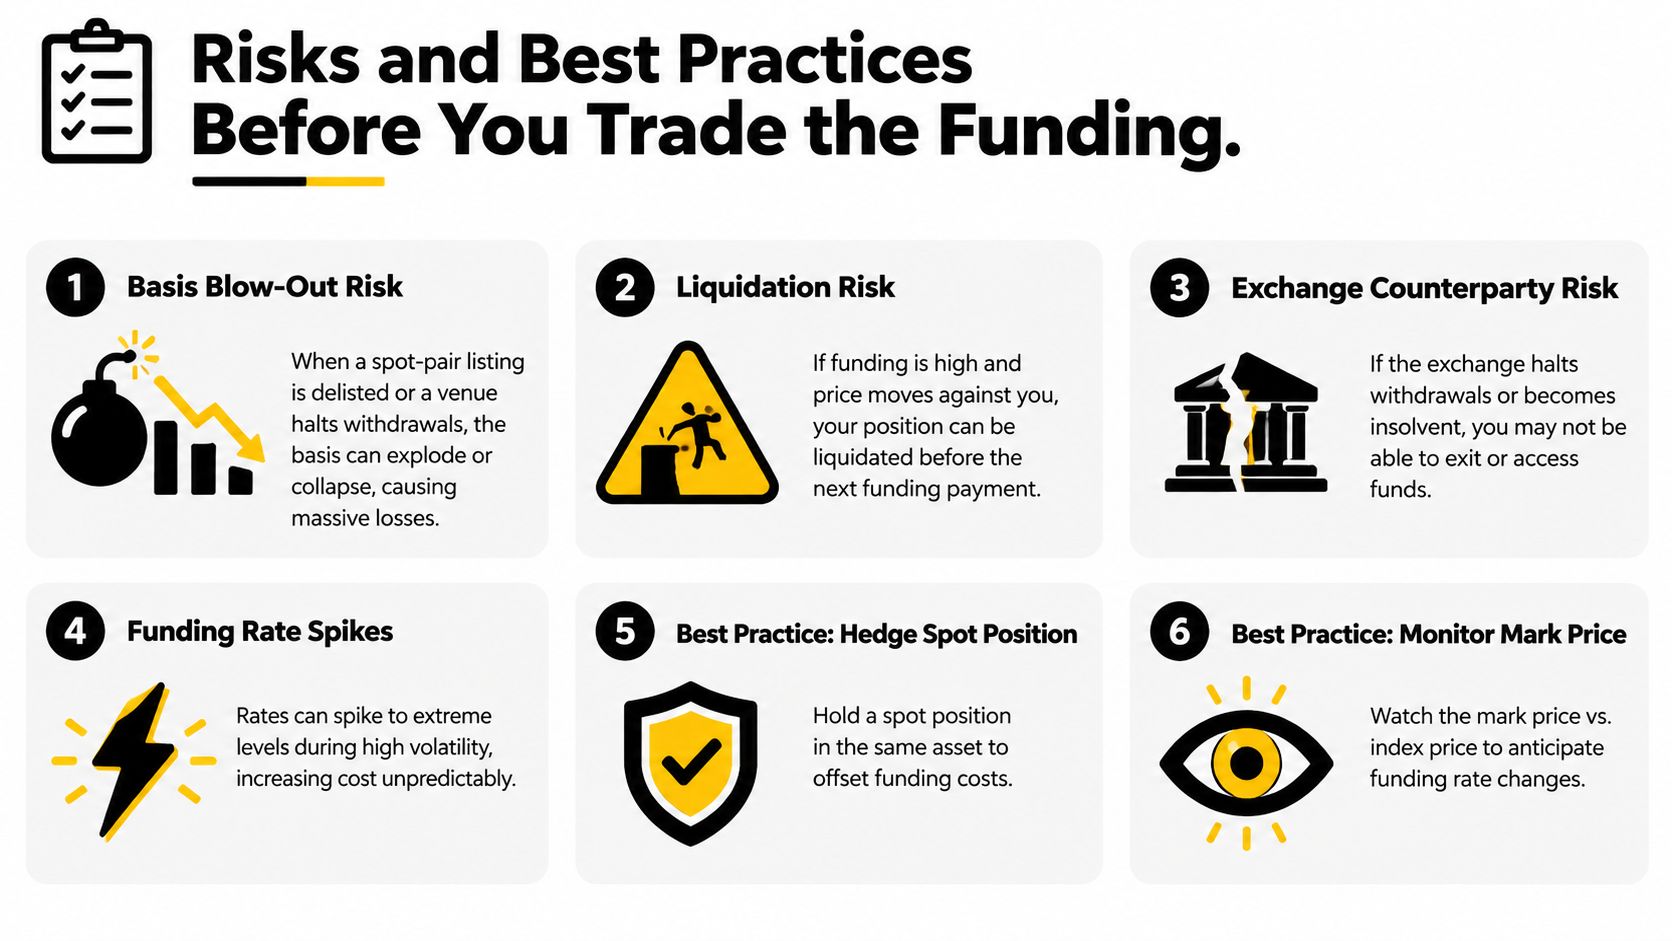
Funding-rate trades fail in the gap between a clean spreadsheet and a disorderly market. A cash-and-carry position can lose money if the basis widens before convergence. A reverse carry trade can become expensive when the borrowed asset is recalled. A cross-exchange position can become one-sided if a venue freezes withdrawals, changes margin rules, or marks the contract differently.
The risks that deserve a written response
- Basis blowout: A delisting, spot-market disruption, or withdrawal halt can cause the spot and perpetual legs to move apart instead of converging.
- Settlement mismatch: Funding schedules don't always line up. One venue may settle hourly while another uses an eight-hour schedule, so a spread can change before both legs pay.
- Liquidation exposure: High funding can coexist with violent price movement. A supposedly hedged perp leg can be liquidated before the next payment.
- Counterparty exposure: Funds held on separate exchanges remain exposed to operational and solvency problems at each venue.
- Borrow and tax costs: Reverse cash-and-carry depends on borrow availability, while funding income may receive different tax treatment across jurisdictions. Confirm the applicable rules with a qualified local adviser.
Mitigation starts with sizing. A trader should model whether the position can survive a 50 basis-point basis widening before entry, rather than assuming convergence will arrive on schedule. Pre-stage sufficient margin across both venues, keep settlement timestamps in UTC, and calculate break-even funding after trading fees, borrow, transfers, and slippage.
A pre-trade checklist
- Confirm both legs are live. Check order-book depth, contract status, index composition, and withdrawal conditions.
- Define the exit trigger. Decide whether you'll exit when funding normalizes, the spread closes, margin falls, or venue conditions change.
- Separate hedge from speculation. A delta-neutral spot holding can offset price exposure, but it doesn't remove exchange or basis risk.
- Review collateral location. Never commit money that you may need while it remains locked in a cross-margin balance during a depeg or operational interruption.
- Test the settlement math. Verify whether the displayed rate is per interval, annualized, predicted, or final.
The mechanics are simple enough to calculate, but the trade is only as strong as its weakest leg. Use the cash-and-carry checklist for positive funding, the reverse-carry checklist for negative funding, and the cross-exchange checklist whenever the opportunity depends on two venues behaving normally.
Coiner Blog offers practical cryptocurrency guides and balanced analysis across Bitcoin, Ethereum, DeFi, Web3, tokenomics, and emerging blockchain markets. Visit Coiner Blog to follow funding-rate explainers, derivatives risk guides, and new coverage designed to help you evaluate crypto opportunities with clearer assumptions.