
Crypto Fear & Greed Index Explained for Smart Trading
Bitcoin drops hard overnight. Your phone lights up with liquidation posts, doom threads, and charts full of red candles. A week later, the same timeline flips. People are calling for new highs, altcoins are running, and every dip looks “obviously” buyable.
That swing in mood is normal in crypto. It happens faster here than in most markets because trading never sleeps, retail participation is high, and narratives spread across X, Telegram, YouTube, and Discord in real time. Bitcoin often leads the emotional tempo, but Ethereum, DeFi tokens, Layer 2 plays, and newer Web3 narratives usually feel the shockwaves.
That's why the Crypto Fear & Greed Index became such a familiar reference point. It gives traders one number to summarize whether the market feels defensive or euphoric. Used well, it can help you slow down and separate crowd emotion from your own decision-making. Used badly, it becomes a shortcut that turns into a trap.
If you're trying to make sense of crypto sentiment in the current cycle, it also helps to place this tool inside bigger market shifts such as ETFs, tokenized real-world assets, AI-driven trading workflows, and changing retail behavior. For broader context, this overview of crypto and blockchain trends for 2026 is a useful companion read.
Table of Contents
- Introduction to Market Sentiment and Why It Moves Crypto
- What the Crypto Fear & Greed Index Really Measures
- How the Index Is Calculated and Updated
- How to Interpret and Use the Index Without Misreading It
- Limitations Pitfalls and Why It Is Not a Crystal Ball
- Historical Examples and What Past Cycles Teach Us
- Smarter Alternatives and Complementary Sentiment Tools
Introduction to Market Sentiment and Why It Moves Crypto
Crypto is unusually sensitive to emotion because so much of the market trades on expectation. A stock can lean on revenue, margins, and guidance. A token often trades on network growth, user attention, tokenomics, liquidity conditions, and whether the market believes the narrative still has room to run.
That doesn't make crypto irrational. It means sentiment becomes part of the mechanism. When traders expect upside, they add risk faster. When they fear a cascade, they pull liquidity and rotate into safer positions just as quickly.
Why mood matters more in crypto
Three features make sentiment especially powerful here:
- Always-on trading: Bitcoin and Ethereum don't close for the weekend. Fear can compound at any hour, and greed can snowball just as fast.
- Narrative-heavy markets: New sectors such as AI and crypto, Layer 2 networks, DeFi protocols, and real-world asset tokenization can attract capital before fundamentals are easy to compare.
- Fast feedback loops: Price drops trigger social panic. Social panic influences positioning. Positioning pushes price further.
Crypto often moves in a loop where price affects mood, and mood feeds back into price.
What readers usually get wrong
Many beginners think sentiment is a soft concept, almost like gossip. Seasoned traders can make the opposite mistake and over-systematize it. Both miss the point.
Sentiment isn't fluff, but it also isn't a standalone edge. It's context. It tells you how stretched the crowd may be, how reactive the market feels, and whether people are trading from patience or impulse.
That's where the Crypto Fear & Greed Index enters the picture. It tries to compress a messy set of signals into a simple daily reading. The useful part isn't the drama of the label. The useful part is learning what that reading captures, what it misses, and why a Bitcoin-centered mood gauge may not map cleanly onto every altcoin, DeFi token, or smart contract platform.
What the Crypto Fear & Greed Index Really Measures
You wake up to Bitcoin sliding fast, crypto Twitter is full of panic, and the Fear & Greed Index flashes deep fear. Later that week, price rebounds, volatility cools, and the gauge swings back up. That quick shift tells you something useful, but not what many readers assume.
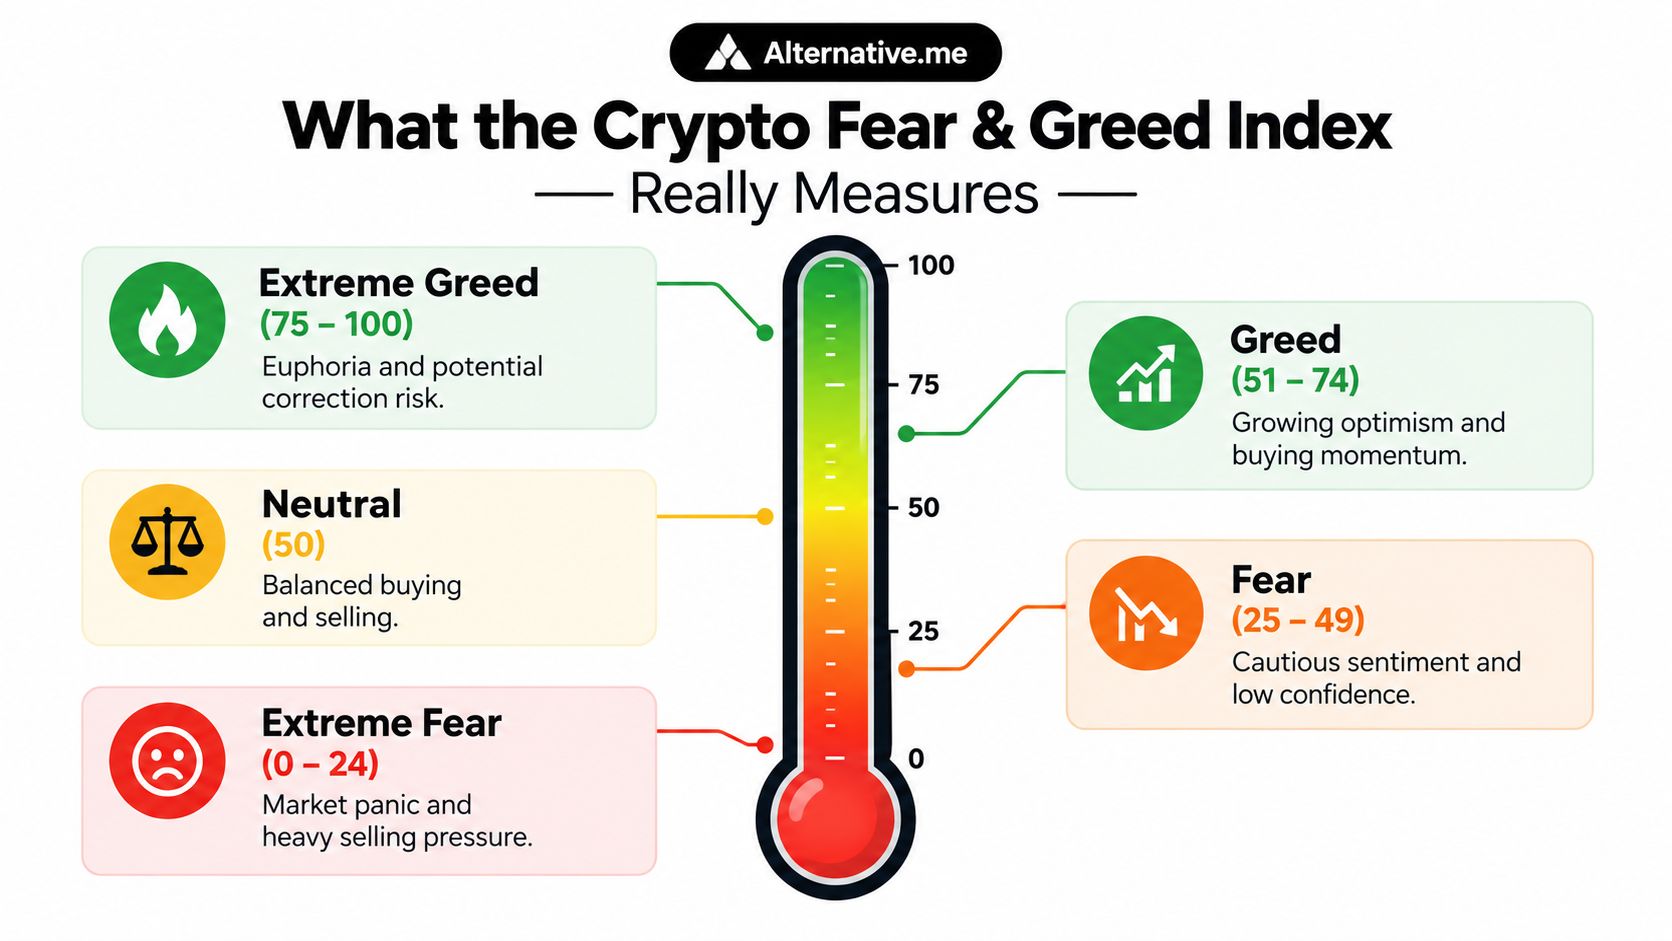
The index works more like a crowd-psychology mirror than a trading command. The familiar 0 to 100 scale, published in Alternative.me's Crypto Fear & Greed Index, summarizes whether the market is acting stressed, comfortable, or euphoric at a given moment.
How to read the scale like a human, not a robot
The labels are simple. The behavior underneath them is less simple.
A low reading usually shows defensive behavior. Traders cut risk, sell into weakness, or wait for calmer conditions. A high reading points to stronger risk appetite, rising confidence, and a greater willingness to chase momentum.
| Zone | What it often feels like |
|---|---|
| Extreme Fear | Panic, forced selling, “get me out” behavior |
| Fear | Caution, skepticism, low confidence |
| Neutral | Mixed conviction, less emotional trading |
| Greed | Optimism, stronger buying appetite |
| Extreme Greed | Euphoria, FOMO, crowded positioning |
The key nuance is that the index reflects how people are reacting to market conditions. It does not measure whether an asset is underpriced or overpriced.
It tracks mood through market behavior
That distinction matters because the index is often treated like a buy or sell button. It is better understood as a compressed reading of crowd behavior, using signals such as price action, volatility, and attention.
That also means it can partly count the same stress twice. If Bitcoin drops hard, volatility rises. If volatility rises, fear readings usually rise too. In practice, the gauge is often responding to price weakness and the turbulence around that weakness at the same time. For traders, that makes it useful as a sentiment snapshot, but less clean as an independent signal.
A thermometer is still a helpful analogy here. It can confirm that the room feels hot. It cannot explain whether the heat came from the sun, a crowded room, or a broken heater.
Why Bitcoin bias matters more than many guides admit
The best-known version of the index is heavily shaped by Bitcoin. That makes sense because Bitcoin still sets the emotional tone for much of crypto. But it also creates blind spots.
An altcoin rally can be underway while the index stays cautious because Bitcoin is weak. The opposite can happen too. Bitcoin can look calm while smaller sectors are already showing speculative excess. Research from CoinMarketCap's Fear and Greed Index overview also describes the indicator as a sentiment gauge for the crypto market, but in practice the inputs are still weighted toward Bitcoin-led conditions.
This gets even trickier in the ETF era. Spot Bitcoin ETF flows can push price and volume in ways that reflect institutional allocation, hedging, or macro positioning rather than broad retail emotion. The index may still print “greed” because Bitcoin is rising with strong participation, even if that enthusiasm is not spreading evenly across Ethereum, DeFi, gaming tokens, or newer sectors.
So the smartest way to read the number is this: it shows how the Bitcoin-centered crowd is behaving, not what the whole crypto market is worth, and not what every crypto segment is feeling at the same time.
How the Index Is Calculated and Updated
A single fear and greed number can look precise, almost like a thermometer reading. The calculation is messier than that. It is a blended score built from several market signals, and some of those signals overlap enough that the final reading can end up counting the same emotional move twice.
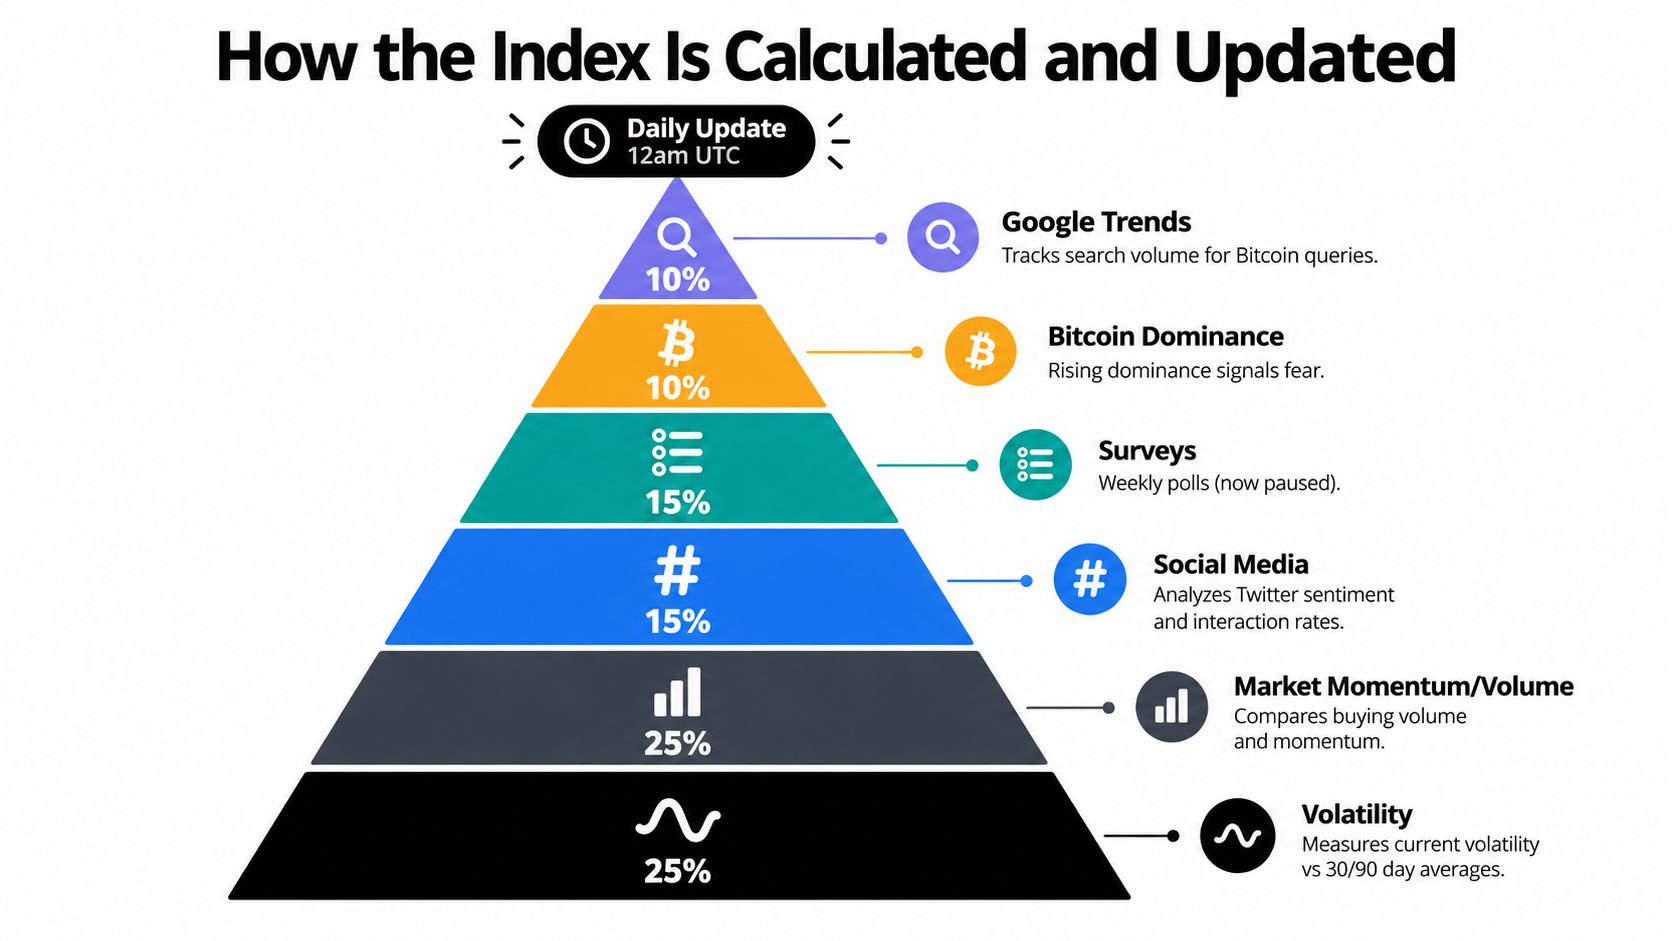
In the classic Alternative.me-style model summarized by Voice of Chain's explanation of the Alternative.me Fear & Greed API, the basket includes volatility 25%, market momentum and volume 25%, social media 15%, Bitcoin dominance 10%, Google Trends 10%, and surveys 15%.
Where most of the score comes from
The biggest drivers are usually volatility and momentum with volume.
Volatility compares current Bitcoin swings and drawdowns with recent baselines. Coinaligator's methodology overview describes the common approach as a comparison against 30-day and 90-day baselines. If price starts whipping around more than usual, the model leans toward fear. If conditions calm down after a rough stretch, that pressure can fade.
Momentum and volume ask a different question. Are buyers showing up with force, or is price drifting without broad participation? Strong upside movement with active trading usually pushes the reading higher.
Those two inputs sound separate, but in practice they often react to the same event. A hard Bitcoin selloff can raise volatility and weaken momentum at the same time. A strong BTC breakout can improve both. That overlap is why the index works better as a mirror of crowd behavior than as a clean, independent measure of sentiment.
The smaller inputs still matter
The remaining pieces add context, though they are usually noisier:
- Social media: Measures whether crypto conversation is accelerating and how strongly users engage.
- Bitcoin dominance: Tracks whether capital is concentrating in BTC or rotating into higher-risk areas.
- Google Trends: Captures changes in public search interest around Bitcoin and related terms.
- Surveys: Often cited in the original formula, but CFGI's comparison of Alternative.me and CFGI notes that the survey component has been paused in recent periods, which shifts more influence to market and attention data.
This mix also explains why the index can change even when spot price looks quiet. Search activity can jump after a headline. BTC dominance can rise because traders are getting defensive. Social chatter can surge before a broad market move shows up on the chart.
A short explainer helps here:
Why newer versions do not always agree with the classic one
Newer indexes cast a wider net. Some now include derivatives, on-chain activity, liquidity conditions, and capital-flow data that the older public formula barely touched.
CoinMarketCap's Fear and Greed Index page describes its version as a composite of five measurable inputs: top-10 crypto price momentum excluding stablecoins, 30-day implied volatility from Volmex for BTC and ETH, options-market put/call ratios, Bitcoin's market-cap share relative to major stablecoins, and proprietary search and user-engagement signals.
That broader design matters in the ETF era. Bitcoin can attract large flows for reasons that have little to do with retail excitement across the rest of crypto. An ETF-driven move in BTC may lift momentum, volume, and search interest enough to push a sentiment gauge higher, even while altcoins, DeFi, or gaming tokens stay flat. Older Bitcoin-first formulas can miss that split.
How often the number updates, and why it can feel late
Most versions update on a daily schedule. That makes the reading useful for context, but less useful for fast execution.
Crypto can swing hard within hours. Funding can flip, macro news can hit, ETF flow headlines can change the tone, and none of that has to wait for the next daily print. So a stale-looking reading does not always mean the formula failed. It often means the index is doing what daily sentiment gauges do: compressing a fast, uneven market into one calm-looking number.
How to Interpret and Use the Index Without Misreading It
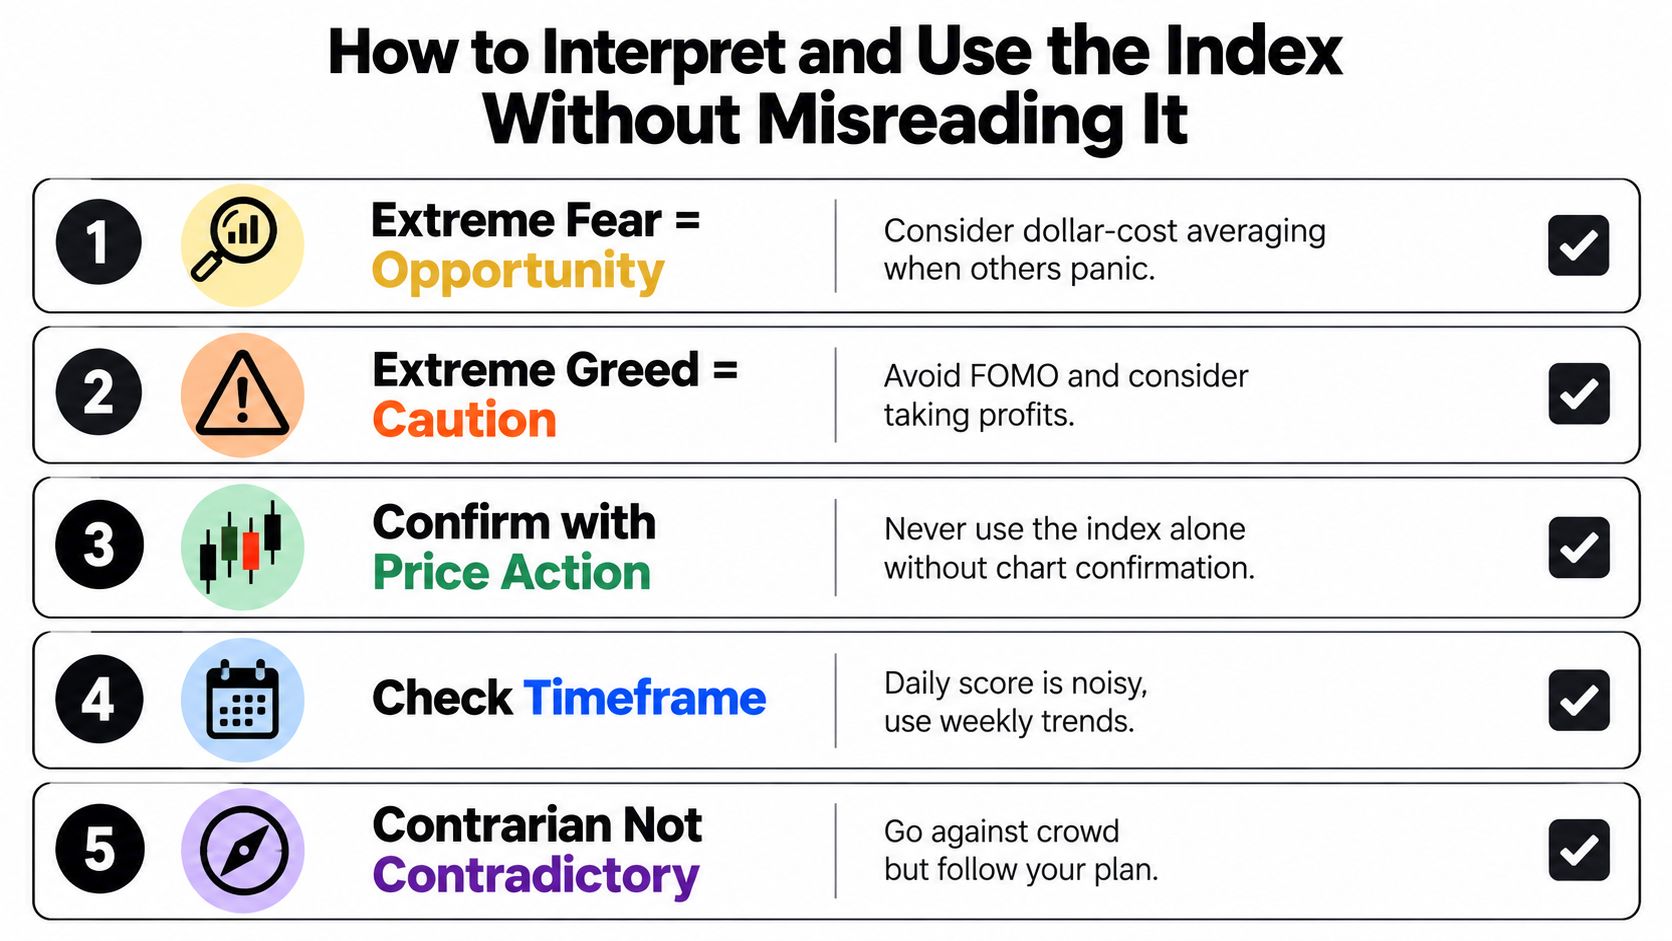
The classic reading is simple. Extreme Fear can signal that panic is high. Extreme Greed can warn that optimism is getting crowded. That framing is useful, but only if you treat it as a starting point rather than a command.
Most mistakes come from turning a mood gauge into a direct trade signal. Traders see a low number and buy instantly, or a high number and sell instantly. Markets don't have to cooperate. Fear can persist in a downtrend. Greed can stay high in a strong breakout.
A better way to use the reading
Think in terms of checks, not predictions.
| Reading zone | Useful response | What to verify first |
|---|---|---|
| Extreme Fear | Slow down and look for forced selling or oversold conditions | Trend strength, support areas, volume behavior |
| Fear | Watchlists become more interesting | Whether weakness is broad or asset-specific |
| Neutral | Usually low urgency | Whether another tool gives a clearer edge |
| Greed | Review exposure and discipline | Whether momentum still has healthy participation |
| Extreme Greed | Tighten risk controls and avoid impulsive chasing | Whether price is accelerating away from structure |
Practical uses for different types of investors
For newer investors, the index can help prevent emotional buying after a vertical move. If the market is already euphoric, that's often the worst time to abandon your plan.
For long-term accumulators, it can act as a behavioral guardrail. Some investors use fearful conditions as a prompt to review dollar-cost averaging rather than freeze. Others use greedy conditions as a reminder to rebalance.
For active traders, it works best as one line in a broader playbook that also includes trend structure, liquidity, and risk limits. Disciplined process matters more than the score itself. If you want a practical framework for position sizing and downside planning, Coiner Blog's guide to crypto risk management fits well alongside sentiment tools.
A sentiment extreme is a reason to investigate. It isn't proof that a reversal has started.
What not to do
Avoid these habits:
- Don't trade the print alone: A single daily reading can be noisy.
- Don't ignore timeframe: A short-term panic can exist inside a longer-term uptrend.
- Don't force contrarian trades: Going against the crowd only works when your setup and risk plan support it.
- Don't project Bitcoin mood onto every token: A DeFi or Layer 2 name may be trading on protocol-specific news, smart contract activity, or token dynamics.
The best use of the Crypto Fear & Greed Index is psychological. It helps you notice when the crowd is overstretched, including when you may be overstretched with it.
Limitations Pitfalls and Why It Is Not a Crystal Ball
The Crypto Fear & Greed Index is useful because it simplifies complexity. That's also why it can mislead. A clean number feels more authoritative than it really is.
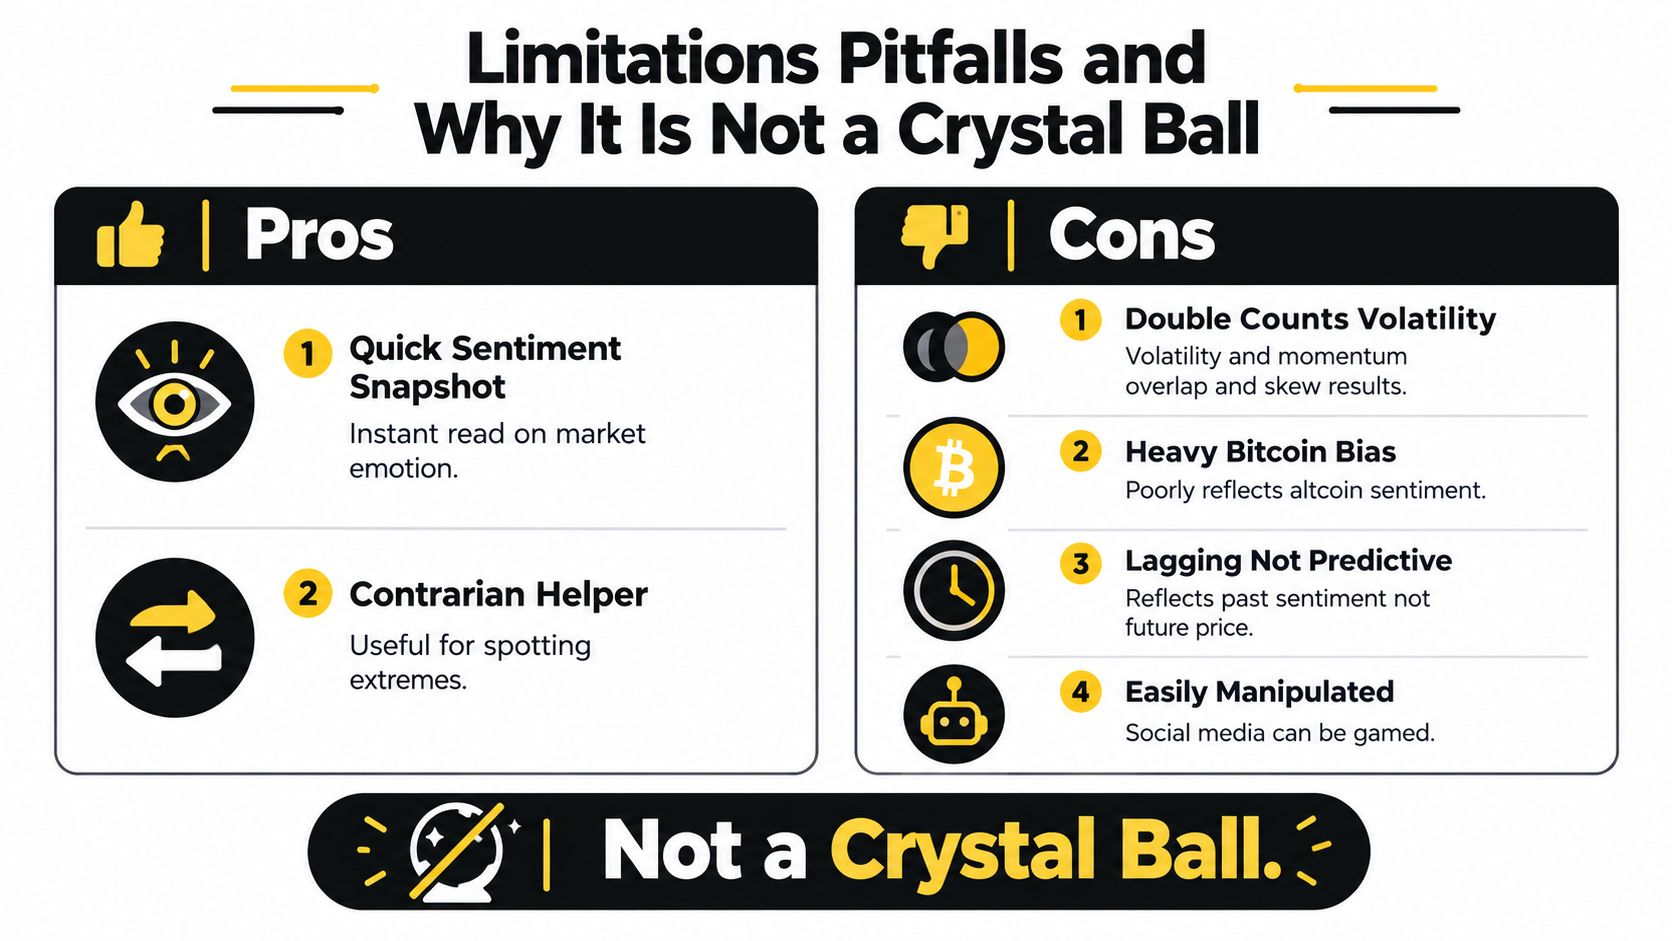
The first weakness is structural. The index often double-counts the same market state. Volatility, momentum, and volume are different inputs, but they frequently move together. A hard selloff can depress the score through several channels at once, which makes the reading feel richer than it may be.
The double-counting problem
Independent academic work makes this point directly. It found that sentiment extremity does not establish a stable or causal liquidity premium, and that any relationship is specification-sensitive rather than proof of predictive power, which matters because the index itself already embeds volatility and momentum inputs in this academic analysis on arXiv.
In plain English, the index may sometimes tell you less new information than it seems to. If price is already plunging and volatility is already exploding, the score may be restating what the chart told you.
Bitcoin bias is not a small detail
Another blind spot is market coverage. Many articles talk about the index as if it reflects “crypto” in full. It doesn't, at least not cleanly.
Recent commentary notes that the methodology combines Bitcoin price action, volatility, volume, dominance, social sentiment, search interest, whale activity, and order-book pressure, while also arguing that Bitcoin ETF assets and institutional flows now dominate moves that older crypto-native sentiment frameworks were built to capture on CFGI's crypto markets analysis.
That has two implications:
- Altcoins can diverge: Ethereum, DeFi, gaming tokens, and AI-related assets may trade on very different catalysts.
- Extreme readings can persist: Institutional flows can keep market structure unusual for longer than a retail mood model would suggest.
Common mistakes that create bad decisions
A short checklist helps more than another theory paragraph:
- Reacting to one print: One extreme reading isn't a complete thesis.
- Ignoring macro context: The index reflects reaction, not the cause of a move.
- Using it as a valuation tool: It doesn't tell you whether Bitcoin or Ethereum is cheap.
- Assuming social data is clean: Attention signals can be noisy and sometimes gamed.
One caution: The score is strongest as a mirror of crowd behavior, and weakest as a stand-alone forecast.
If you remember one limitation, make it this one. The index is better at describing the emotional weather than predicting tomorrow's candle.
Historical Examples and What Past Cycles Teach Us
A trader checks the index after a sharp Bitcoin selloff and sees Extreme Fear. The natural reaction is to treat that reading like a turning point. History argues for a calmer read. Fear shows up often in crypto, while true euphoria is less common and usually shorter-lived.
That pattern matters because the index is less useful as a trigger and more useful as a record of crowd behavior. Over time, it shows that crypto regularly trades in a state of stress, doubt, and fast emotional swings. In other words, fearful readings are part of the market's normal weather, not automatic evidence that a bottom is in.
The bigger lesson is how those moods are created. The index often reacts to price and volatility at the same time, which means one sharp move can influence the score through multiple inputs. That can make panic look deeper than it really is, or make enthusiasm look broader than it really is. In past cycles, that overlap has made the gauge strongest as a mirror of the crowd and weaker as a stand-alone signal.
Bitcoin's role makes the history even trickier to read. A fear reading during a Bitcoin-led liquidation is not the same as a fear reading during an altcoin rotation, an Ethereum-specific breakout, or a sector rally in DeFi or AI tokens. The label can match while the market underneath is very different.
ETF-era flows add another layer. A reading that resembles an older cycle may now be shaped by institutional allocation, hedging, and headline-driven Bitcoin demand rather than retail emotion alone. So a high or low score can look familiar on the surface while reflecting a different mix of participants.
This is why past examples help most when you compare structure, not just numbers.
Ask a few practical questions. Was Bitcoin dragging the whole market lower, or holding up while altcoins weakened first? Was volatility coming from forced liquidations, or from steady repricing after news? Was breadth expanding across sectors, or was capital crowding into a small group of large assets? Those details tell you whether the index is capturing broad sentiment or mostly echoing Bitcoin's move twice.
For readers who want a wider cycle framework for sentiment, momentum, and speculative phases, this guide to the next crypto bull run adds useful context without treating one index as the full story.
Across cycles, the repeatable insight is simple. Panic can persist longer than traders expect. Optimism can stay high for weeks without ending the trend. And because the index is Bitcoin-heavy and partly built from overlapping market reactions, history is most helpful when you use it to compare crowd psychology across regimes, not to predict the next candle.
Smarter Alternatives and Complementary Sentiment Tools
The best upgrade to the Crypto Fear & Greed Index is not abandoning it. It's pairing it with tools that cover what it misses.
One obvious alternative is the broader composite approach used by CoinMarketCap, which includes derivatives inputs such as implied volatility and put/call ratios alongside market structure and engagement data, as covered earlier. Those additions can help when options positioning matters more than spot chatter.
For altcoins, DeFi, and Layer 2 ecosystems, it often makes more sense to add tools like funding rates, long and short positioning, market breadth, stablecoin supply ratios, and on-chain activity. A Bitcoin-heavy mood gauge can miss what's happening inside a smart contract platform, a rollup ecosystem, or a token sector driven by protocol usage rather than macro BTC flows.
A practical workflow is simple:
- Start with broad sentiment: Use the index to identify emotional extremes.
- Cross-check positioning: Funding, long and short ratios, and put/call behavior can reveal whether traders are overcrowded.
- Check asset-specific context: For Ethereum, DeFi, or Web3 sectors, on-chain activity and liquidity often matter more than a generic crowd score.
- Keep a written process: A research journal or framework helps prevent emotional drift. Coiner Blog's guide to market sentiment analysis is one example of how to structure that work.
If you're exploring more automated ways traders respond to sentiment shifts, this explainer on how copy trading bots work is useful because it shows how strategies can mirror signals without replacing judgment.
No single gauge should drive a decision on Bitcoin, Ethereum, a DeFi token, or anything else. The index is most useful when it sharpens your questions, not when it pretends to answer all of them.
Coiner Blog publishes practical crypto education for readers who want more than headlines, including guides on sentiment, risk, market structure, DeFi, Web3, and emerging blockchain trends. If this breakdown helped you read the Crypto Fear & Greed Index with more nuance, visit Coiner Blog for deeper explainers that connect market psychology to real decision-making.