
What Is Fundamental Analysis: A Practical Crypto Guide

You're looking at a token whose chart appears ready to break out, while a project announcement promises a major upgrade. One signal says momentum is building. The other may indicate genuine progress, or just better marketing. The question is what is fundamental analysis, and can it help you decide which signal deserves more weight?
Fundamental analysis is the process of judging an asset's intrinsic value by studying the underlying drivers of cash flows, earnings, utility, and network activity rather than its price action alone. In stocks, that means financial statements, profitability, debt, and valuation. In crypto, the same discipline must be rebuilt around tokenomics, on-chain activity, protocol revenue, governance, and adoption.
This guide connects the traditional framework with crypto-native research. You'll see where the method came from, how it differs from technical analysis, which metrics matter for Bitcoin, Ethereum, DeFi, Web3, Layer 2 networks, and tokenized real-world assets, and how to build a repeatable research process. You'll also get the less comfortable answer: fundamentals are usually a long-horizon filter, not a reliable week-to-week timing device.
Table of Contents
- Why Investors Ask What Fundamental Analysis Really Means
- A Short History of Looking at Business, Not Price
- Fundamental Analysis vs Technical Analysis
- Core Crypto Fundamentals Beyond the Whitepaper
- Valuation Approaches That Actually Apply to Tokens
- A Step-by-Step Process for Analyzing a Token
- Tools, Data Sources, and the Pitfalls That Trip People Up
- Putting It All Together and What to Watch Next
Why Investors Ask What Fundamental Analysis Really Means
A price chart tells you what buyers and sellers have done. Fundamental analysis asks why an asset might deserve its current valuation, and whether the underlying activity can support that valuation over time. That distinction matters because a token can rise while usage weakens, or fall during a broad selloff even as its network keeps developing.
For a company, the underlying drivers are familiar. Analysts examine revenue, earnings, margins, assets, liabilities, and cash generation. For a blockchain project, they may examine transaction fees, active users, stablecoin settlement, developer activity, token emissions, and the share of economic value that reaches token holders.
The method isn't a promise that an analyst will identify the next winning asset before the market does. It's a structured way to separate operational progress from narrative intensity.
Practical rule: Treat fundamental analysis as a way to improve your questions, not as a machine that produces certain answers.
A useful starting resource is Finzer explains fundamental analysis, which provides a general introduction to the discipline. For crypto, however, you need to extend the stock-style framework because many tokens don't publish conventional income statements or represent direct claims on company cash flows.
The rest of the process follows a simple logic:
- Understand the asset: Identify the problem, users, competitors, and mechanism.
- Measure the economics: Study supply, demand, usage, fees, revenue, and incentives.
- Test the valuation: Compare the market value with relevant flows and network activity.
- Stress the thesis: Look for opportunities, concentration, subsidies, governance risks, and regulatory uncertainty.
- Match the horizon: Decide whether the analysis supports a long-term thesis or merely describes current conditions.
That final step prevents a common mistake. A strong fundamental thesis can coexist with poor short-term timing. Markets can reprice faster than adoption, and token prices can move on liquidity, or headlines long before fundamentals become visible.
A Short History of Looking at Business, Not Price
Fundamental analysis didn't begin with crypto, financial television, or even modern stock charts. Its roots lie in early financial ratio analysis, which emerged in the late nineteenth century and initially helped banks and creditors judge creditworthiness rather than forecast stock prices. The historical account in this literature review of financial ratio analysis traces how the field developed from a narrow focus on liquidity into a broader framework for comparing companies.
An early merchant didn't need a quoted market price to decide whether to extend credit. The practical questions were more direct: could the counterparty pay current obligations, how much inventory or receivables supported the business, and how heavily did it rely on debt? A ratio such as the current ratio turned scattered accounting information into a comparison that a lender could use.
By the first decade of the twentieth century, ratio analysis had become established around lending decisions. By the mid-twentieth century, analysts were applying it more broadly to profitability, valuation, and investment decisions. James O. Horrigan's 1968 work, A Short History of Financial Ratio Analysis, documented this evolution, while academic reviews also identify Horrigan and Lev as important figures in formalizing ratios as tools for comparing financial statements across companies and time.
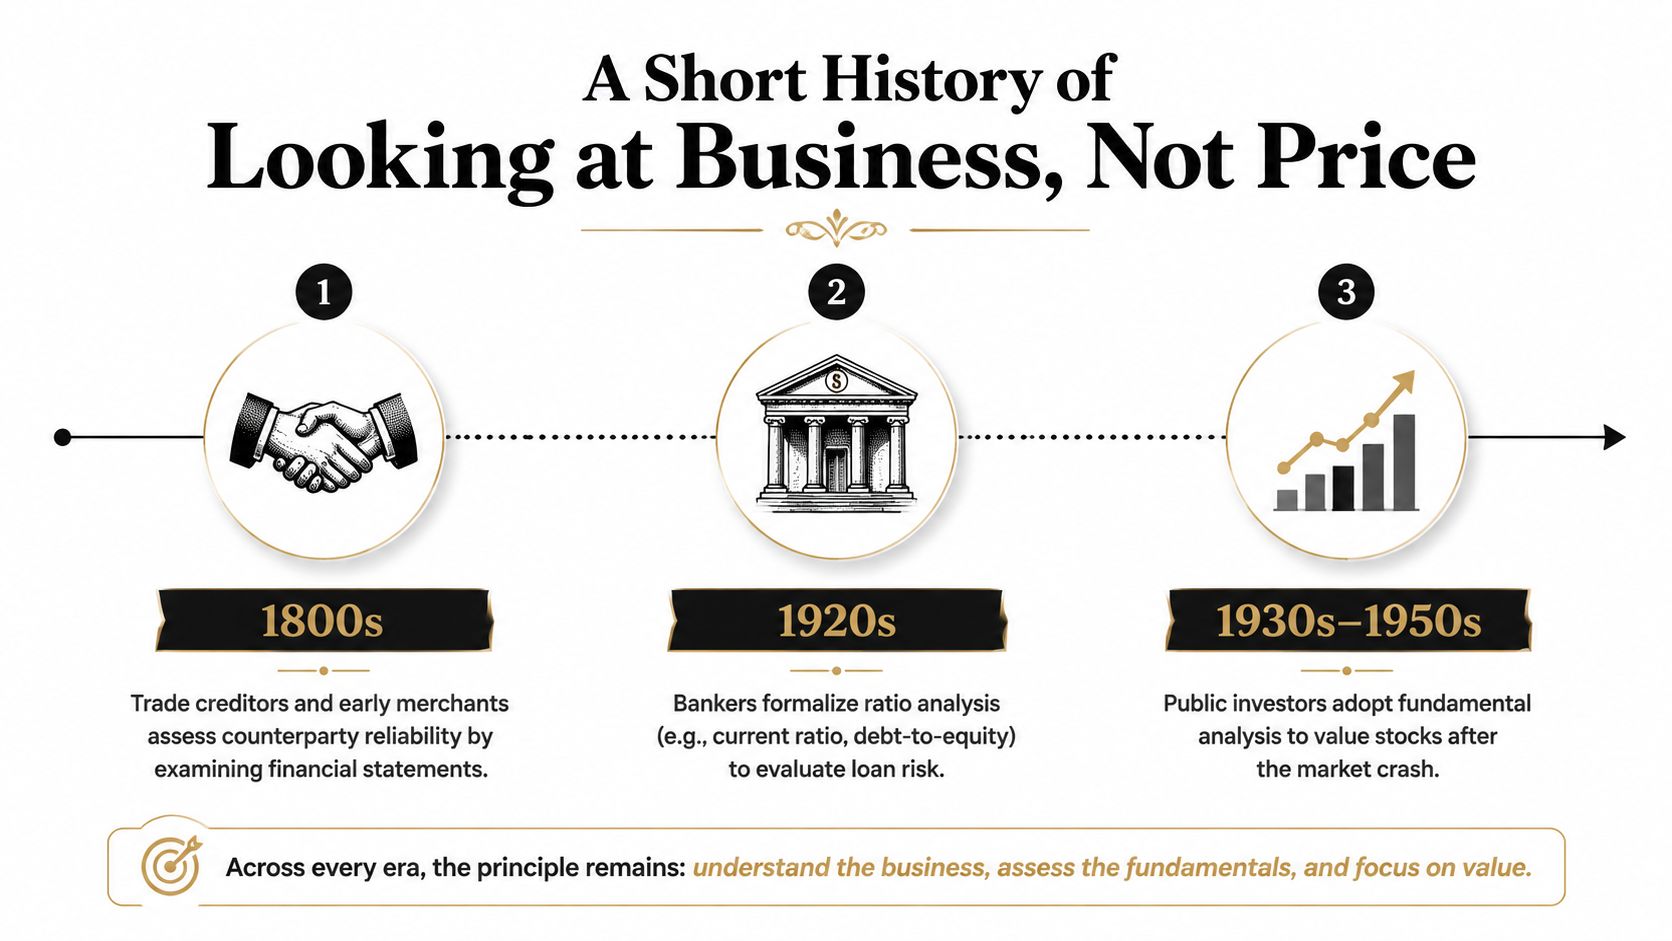
Why the old framework still matters
The three-statement model preserves that original purpose. The income statement describes earnings power, the balance sheet shows capital structure and net assets, and the cash flow statement reveals how the business generates and spends cash. Analysts then forecast value drivers and compare an intrinsic value estimate with the market price.
Crypto doesn't fit neatly into that template. Bitcoin has no corporate income statement. Ethereum's ecosystem includes applications, validators, users, and a native asset with monetary and utility properties. A DeFi protocol may collect fees while distributing much of its revenue as incentives. The challenge isn't abandoning fundamental analysis. It's identifying the equivalent economic evidence in a system built from smart contracts rather than conventional corporate reporting.
Fundamental Analysis vs Technical Analysis
A token can look strong on a chart while its economics are deteriorating. It can also have credible fundamentals and still fall sharply during a liquidation wave. Fundamental analysis asks what an asset may be worth, based on its underlying economics. Technical analysis asks how market participants are behaving, using price, volume, liquidity, and chart patterns.
The two methods serve different jobs. Fundamental research examines whether a protocol has durable demand, sustainable activity, and token economics that support ownership. Technical analysis studies momentum, market structure, and potential trade timing. Neither method consistently answers every investment question.
| Dimension | Fundamental Analysis | Technical Analysis |
|---|---|---|
| Goal | Estimate intrinsic value and assess financial or network health | Identify trends, momentum, support, resistance, and possible entry or exit zones |
| Inputs | Revenue, margins, cash flow, users, fees, token supply, governance, treasury, and adoption | Price, volume, volatility, market depth, chart patterns, and indicators |
| Typical horizon | Multi-month to multi-year research | Short-term to medium-term trading and position management |
| Useful setting | Comparing business quality, dilution, sustainability, and valuation | Timing liquid markets and managing defined trade setups |
| Main blind spot | Historical data may lag new information, and value can remain mispriced | Patterns can fail during regime changes, protocol upgrades, liquidity shocks, or narrative shifts |
The time horizon changes which lens deserves more weight. Fundamentals are more useful for deciding whether a token may compound adoption over a longer period. They are less useful for predicting the next trading session, where forced selling, changing liquidity, and other market pressures can dominate. Technical tools can help define an entry, exit, or risk limit, but they cannot repair weak token economics.
A chart may show Ethereum outperforming Bitcoin without explaining whether application fees, validator economics, or Layer 2 activity support that move. The reverse problem appears when an analyst studies token supply and protocol usage but ignores a liquidation event that could continue pressuring price in the near term.
Readers interested in the equity side can use equity research blog posts to see how analysts organize company research around financial performance, industry context, and valuation. Crypto analysis follows a similar logic, yet its inputs are less standardized. On-chain activity, governance, treasury assets, and token distribution often require interpretation rather than simple comparison.
Keep the lenses separate. Use fundamentals to decide what you're willing to own and why. Use technical tools, if you choose them, to decide how and when to express that view. A bullish chart does not turn a weak protocol into a strong investment thesis, and a sound thesis does not remove timing risk.
Core Crypto Fundamentals Beyond the Whitepaper
A whitepaper explains intent. Fundamental analysis tests whether the system creates useful activity and whether the token captures enough of that activity to justify its role. Four pillars provide a practical starting point: tokenomics, on-chain metrics, off-chain metrics, and the team or project itself.
Tokenomics describes the supply and incentive system
Tokenomics covers maximum supply, circulating supply, total supply, issuance, burns, fees, utility, distribution, and vesting. Maximum supply is the hard cap on tokens that can ever exist. Total supply reflects issued tokens minus burned tokens. Circulating supply is the portion currently tradable.
A token can have strong demand and still face pressure if emissions or insider token releases expand supply faster than buyers absorb it. Read the project documentation, then verify the schedule through contract data and wallet movements rather than relying on a promotional summary.
On-chain metrics show observable use
On-chain data lets you inspect activity directly. Active addresses, transaction counts, fees, stablecoin flows, exchange balances, and protocol revenue can reveal whether usage is broadening or merely being generated by incentives.
The interpretation matters more than the raw count. A spike in transactions may reflect bots, arbitrage, or spam. Rising fees may indicate demand, but they can also make a network less attractive to users. Compare trends with competitors and examine whether the activity produces revenue or token demand.
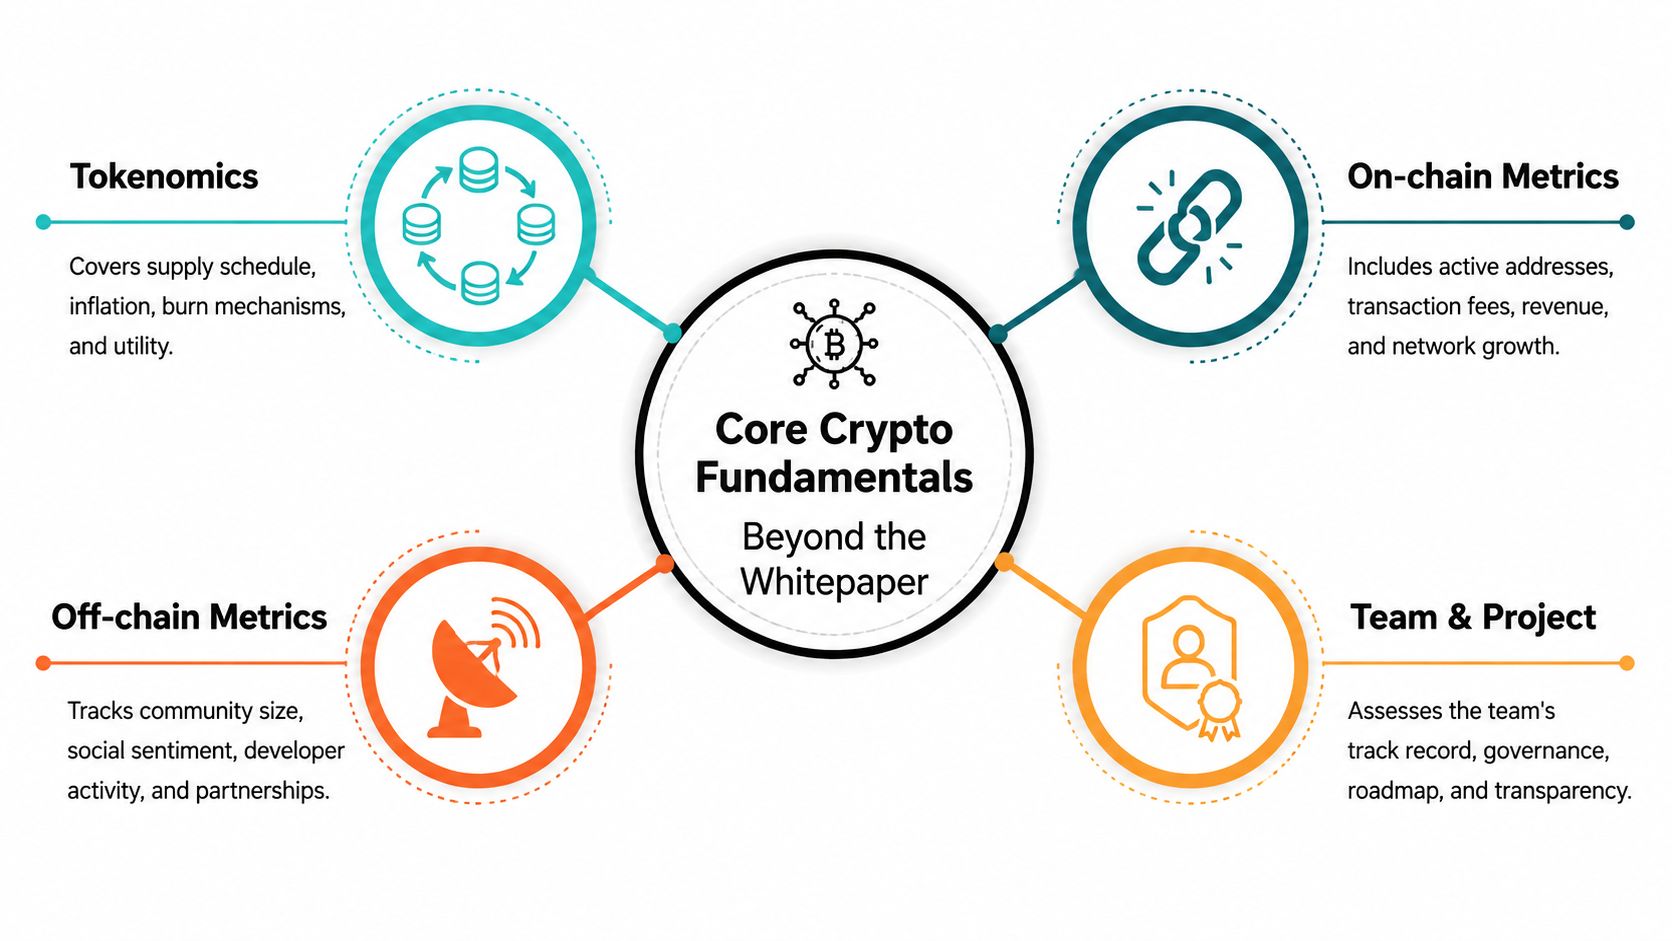
Off-chain evidence supplies context
GitHub activity, audit reports, governance forums, partnership announcements, regulatory developments, and developer headcount help explain what the chain data does and doesn't show. Social sentiment can identify narrative strength, but it shouldn't substitute for evidence of retention, fees, or useful transactions.
People and governance still carry risk
Assess the team's track record, transparency, treasury runway, governance design, and concentration of decision-making. A technically impressive protocol can remain fragile if a small group controls upgrades, treasury funds, or token distribution.
No pillar is sufficient on its own. A large community doesn't prove economic sustainability, and a polished whitepaper doesn't prove product-market fit. The strongest analysis looks for agreement across supply mechanics, actual usage, external execution, and credible governance.
Valuation Approaches That Actually Apply to Tokens
Valuation becomes difficult when a token doesn't represent a direct claim on protocol revenue. Start by asking whether the asset captures economic value at all. A protocol may generate fees, yet route them to liquidity providers, validators, a treasury, or users instead of token holders. That distinction separates network activity from token value capture.
A discounted cash flow model can work for a protocol with recurring revenue that the token can credibly access. Forecast fees, operating costs, reinvestment, and distributions, then discount those future cash flows. The model becomes unreliable when the apparent revenue consists mainly of temporary subsidies or emissions rather than durable demand.
A fee-based multiple provides a simpler comparison for cash-generating protocols. It resembles a P/E-style approach, but it uses protocol fees or token-relevant cash flows instead of corporate earnings. Traditional market measures include P/E, P/B, EV/EBITDA, P/CF, and free cash flow yield, but each needs normalization against comparable businesses and capital structures, as explained in Fidelity's guide to company valuation ratios.
| Method | Data Needed | Best For | Main Caveat |
|---|---|---|---|
| Discounted cash flow | Sustainable fees, costs, growth, and token capture | Protocols with visible recurring cash flows | Sensitive to assumptions and unreliable when revenue is subsidized |
| Fee-based multiple | Market value and relevant fees or cash flow | Mature applications and networks with measurable monetization | Fees may not accrue to token holders |
| Fully diluted valuation | Current price and the entire eventual token supply | Projects with substantial future unlocks | It can overstate near-term economic reality if supply is not yet liquid |
| NVT | Market capitalization and transaction value | Networks where transaction settlement is economically meaningful | Exchange-driven volume spikes can distort the ratio |
| Market cap to TVL | Market capitalization and total value locked | DeFi protocols with meaningful capital deposits | TVL says little about revenue quality or token capture |
| Price to fees | Token price or market value and network fees | Layer 1s and Layer 2s with fee activity | High fees can reflect congestion rather than durable adoption |
For Bitcoin, NVT can offer a way to compare market value with transaction value, but it isn't a complete monetary or security valuation model. For DeFi, market cap to TVL can provide context, yet it ignores how much revenue the protocol earns from that capital. For Layer 2 networks, price to fees may be informative only when fees reflect lasting demand rather than temporary congestion.
Use valuation as an anchor, not a precision instrument. Governance changes, incentive programs, upgrades, and competitive launches can alter the underlying economics faster than a spreadsheet can capture. Analysts who want more background on the trading environment can also review market microstructure before interpreting thin liquidity or unusual volume.
A Step-by-Step Process for Analyzing a Token
A good research process should work before you have a terminal or a paid data subscription. Start with the project's whitepaper and litepaper, preferably alongside the code repository and governance documentation.
Start with the mechanism
Ask what problem the project solves, who uses it, and why a blockchain is necessary. For an Ethereum Layer 2, that might involve transaction execution and settlement. For a DeFi application, it could involve lending, trading, or collateral management. For an AI and crypto project, identify whether the token coordinates access, pays for computation, rewards contributors, or merely accompanies the narrative.
Don't accept “utility” as an answer by itself. Write the specific action the token enables and what would happen if users could complete the same action without holding it.
Verify supply and ownership
Use CoinGecko, Token Terminal, a block explorer, or the project's token contract to check circulating supply, total supply, emissions, burns, and distribution. Then locate the vesting schedule and inspect major wallets. A token's headline market capitalization can look modest while its future dilution remains substantial.
Token allocation and vesting deserve their own pass. Common structures include a cliff with no releases for 6 to 12 months, followed by linear releases, while team allocations are often around 15% to 25% of supply. These reference ranges are described in this overview of tokenomics, vesting, and emissions, but individual projects can differ sharply.
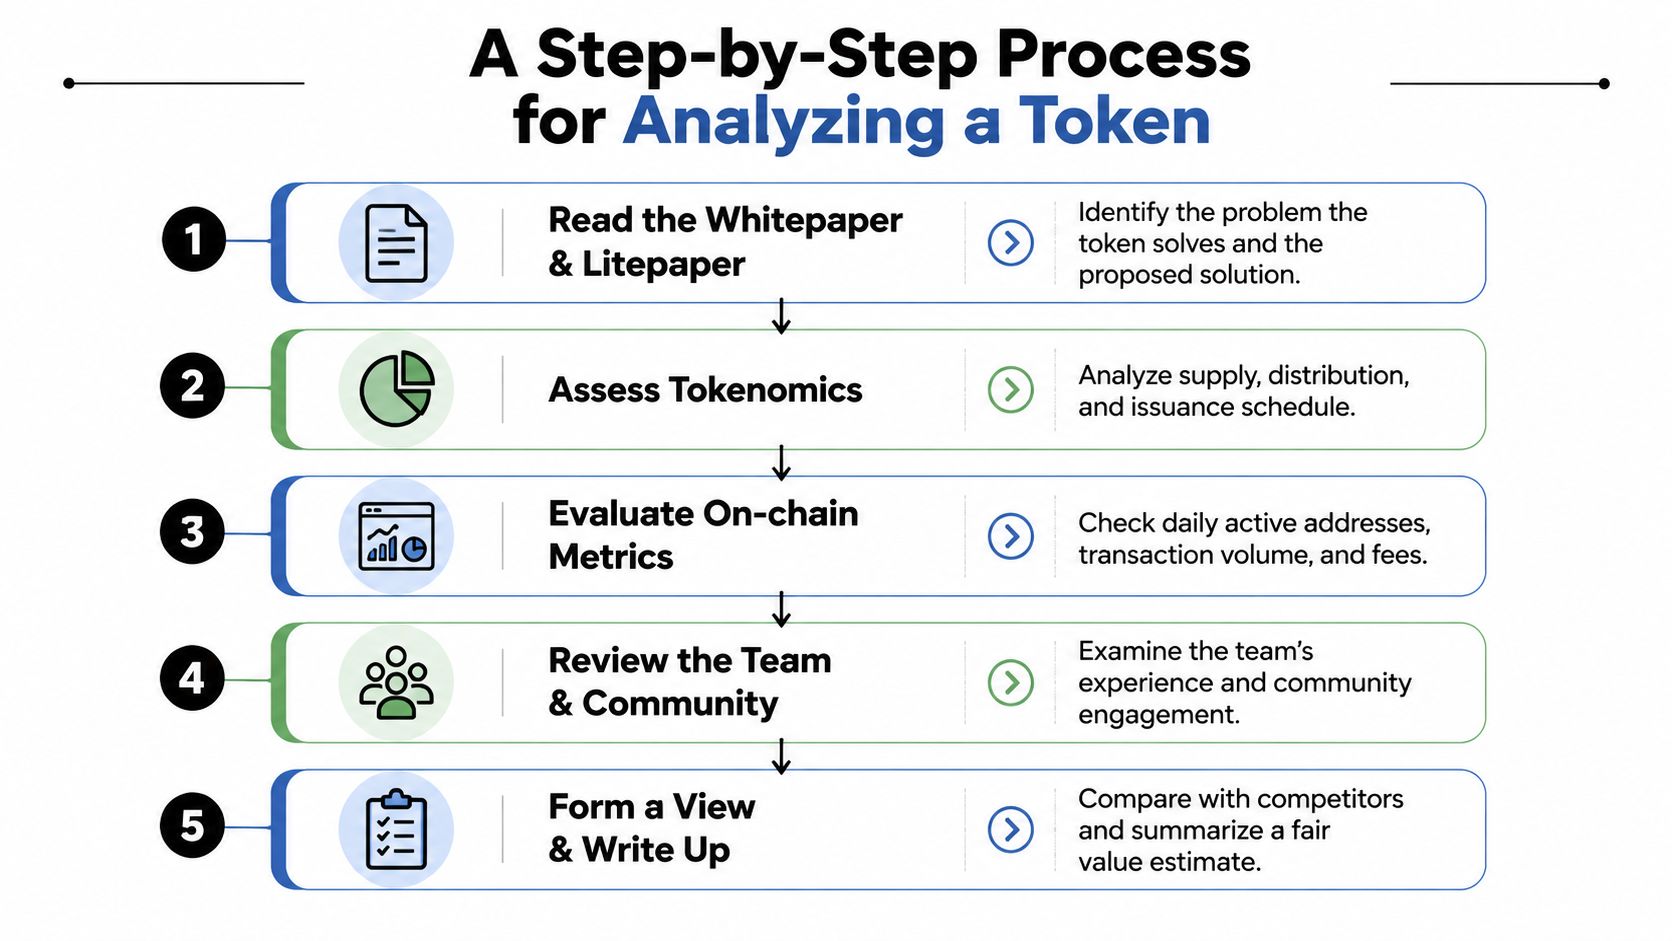
Measure activity and compare it
Pull active addresses, transaction counts, fees, revenue, and relevant flows from a dashboard such as Dune or Token Terminal. Compare the project with close competitors, not with the entire crypto market. A protocol can grow while losing share, and a smaller competitor can be more efficient despite lower absolute activity.
For token standards and contract structure, a primer on ERC-20 tokens can help beginners understand how balances, transfers, and allowances appear on-chain.
Check execution, then write the thesis
Review GitHub activity, audits, governance participation, treasury disclosures, partnerships, and known legal constraints. Finish with one or two relevant valuation ratios, then write a one-page summary containing the bull case, bear case, key assumptions, and invalidation conditions.
Revisit the work quarterly or after major governance votes, upgrades, or changes in protocol revenue. Fundamental analysis is a living record, not a one-time download.
Tools, Data Sources, and the Pitfalls That Trip People Up
A useful research stack combines several views of the same token. Token Terminal organizes revenue, fees, and active-address data. Glassnode supplies advanced on-chain metrics, while Dune lets analysts build custom queries for token activity. Messari provides research and token fundamentals, and Token Unlocks focuses on release schedules. These tools resemble different instruments in a lab: each measures something useful, but none describes the entire project alone.
Wallet and treasury analysis adds context. Nansen helps investigate wallet flows and labeled addresses. GitHub repositories show development activity, while governance forums reveal whether token holders take part in meaningful decisions. Audit reports and credible exchange disclosures can fill gaps. They do not replace the underlying contracts, documentation, or your own review of how the system works.
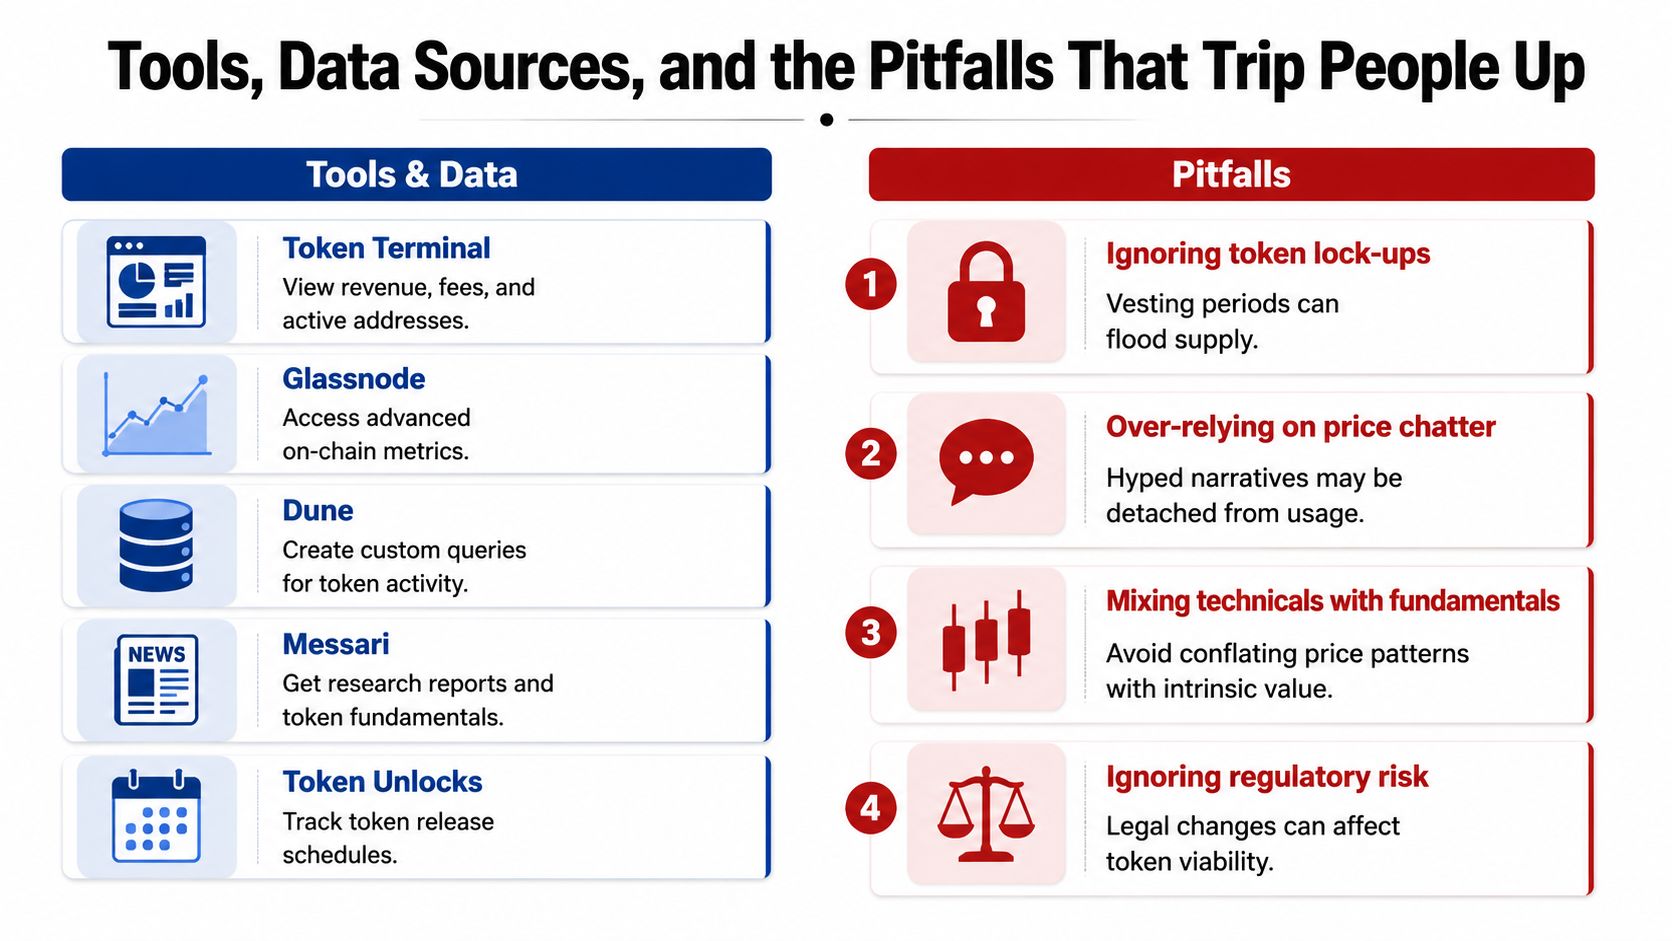
Data can still create a false sense of precision.
- Survivorship bias: Reviewing projects that survived the last cycle makes crypto appear more durable than the full project population.
- Vesting blindness: Ignoring vesting calendars hides the risk of new supply arriving without matching demand.
- Revenue confusion: Protocol revenue does not automatically belong to token holders. Trace fees through the treasury, burns, staking, buybacks, or distributions.
- Multiple matching: A DeFi application, infrastructure token, Bitcoin, and an Ethereum Layer 2 require different valuation methods.
- Short-horizon pressure: A sound thesis can look wrong while liquidity, macro conditions, or a competing narrative dominate prices.
- Data quality gaps: Active addresses may include automated activity, and transaction volume may include low-value transfers or incentive farming.
Coiner Blog's fundamental crypto asset score offers another structured checklist. Use it beside your own research, not as a substitute for examining assumptions and evidence.
The contrarian conclusion is straightforward. Fundamentals rarely improve entry timing from one week to the next. A 2025 DeFi research report found no reliable improvement at the 1-month horizon, while fundamental metrics improved prediction by +2.12 percentage points at 3 months and +8.66 percentage points at 6 months, with fundamentals explaining up to 88% of six-month variance in some settings (Greenfield Capital report). That evidence does not turn fundamentals into a trading signal. It supports using them for medium-term screening and stronger conviction.
Putting It All Together and What to Watch Next
A portable fundamental checklist should fit on one page. Start by scoring the tokenomics, vesting exposure, supply growth, and holder concentration. Then ask whether the protocol has active users, meaningful transaction demand, recurring fees, and revenue that reaches the token in a defensible way.
Add the qualitative layer. Consider the team's execution history, governance transparency, treasury management, audits, developer activity, and competitive position. A technically capable project can still produce a weak token if the supply schedule overwhelms demand or if governance gives insiders excessive control.
Finally, cross-check valuation with at least one relevant ratio. NVT may help for a settlement network, market cap to TVL may provide context for DeFi, and price to fees may help with a Layer 1 or Layer 2. Don't force a ratio onto a project because the number is available.
Research standard: Score each dimension separately, record your assumptions, and write down what would make you change your mind.
Crypto market conditions can diverge sharply across sectors. CoinGecko reported that in Q1 2026, total crypto market capitalization fell 20.4% to $2.4T, while stablecoins reached a $316.4B all-time high and real-world asset tokenization rose 38% past $20B (CoinGecko's Q2 2026 crypto report). Those movements illustrate why broad price action isn't enough. Stablecoin settlement, tokenized assets, privacy infrastructure, AI agents, Bitcoin monetary demand, Ethereum application activity, and DeFi revenue can develop on different schedules.
Watch stablecoin liquidity, protocol revenue, user retention, and governance decisions. Improving on-chain accounting standards may also change which metrics analysts trust most. Regulatory clarity and real-world asset tokenization could reshape token utility, while AI and crypto projects will need to demonstrate that technical capability produces durable economic value rather than only narrative attention.
Fundamental analysis is best understood as a filter for survival and valuation, not a promise of perfect timing. It helps you reject weak structures, compare competing networks, and hold a more informed view when sentiment becomes noisy. It cannot remove volatility, forecast every headline, or guarantee that the market will recognize value on your preferred schedule.
Coiner Blog publishes practical guides and analysis on cryptocurrency fundamentals, tokenomics, blockchain networks, DeFi, Bitcoin, Ethereum, and emerging areas such as Layer 2 scaling and real-world asset tokenization. Visit Coiner Blog to continue building a research process that examines usage, supply, risk, and value capture before relying on a token's price chart.