Cryptocurrency ramblings
NFT Price Floor Explained: A Trader’s 2026 Guide

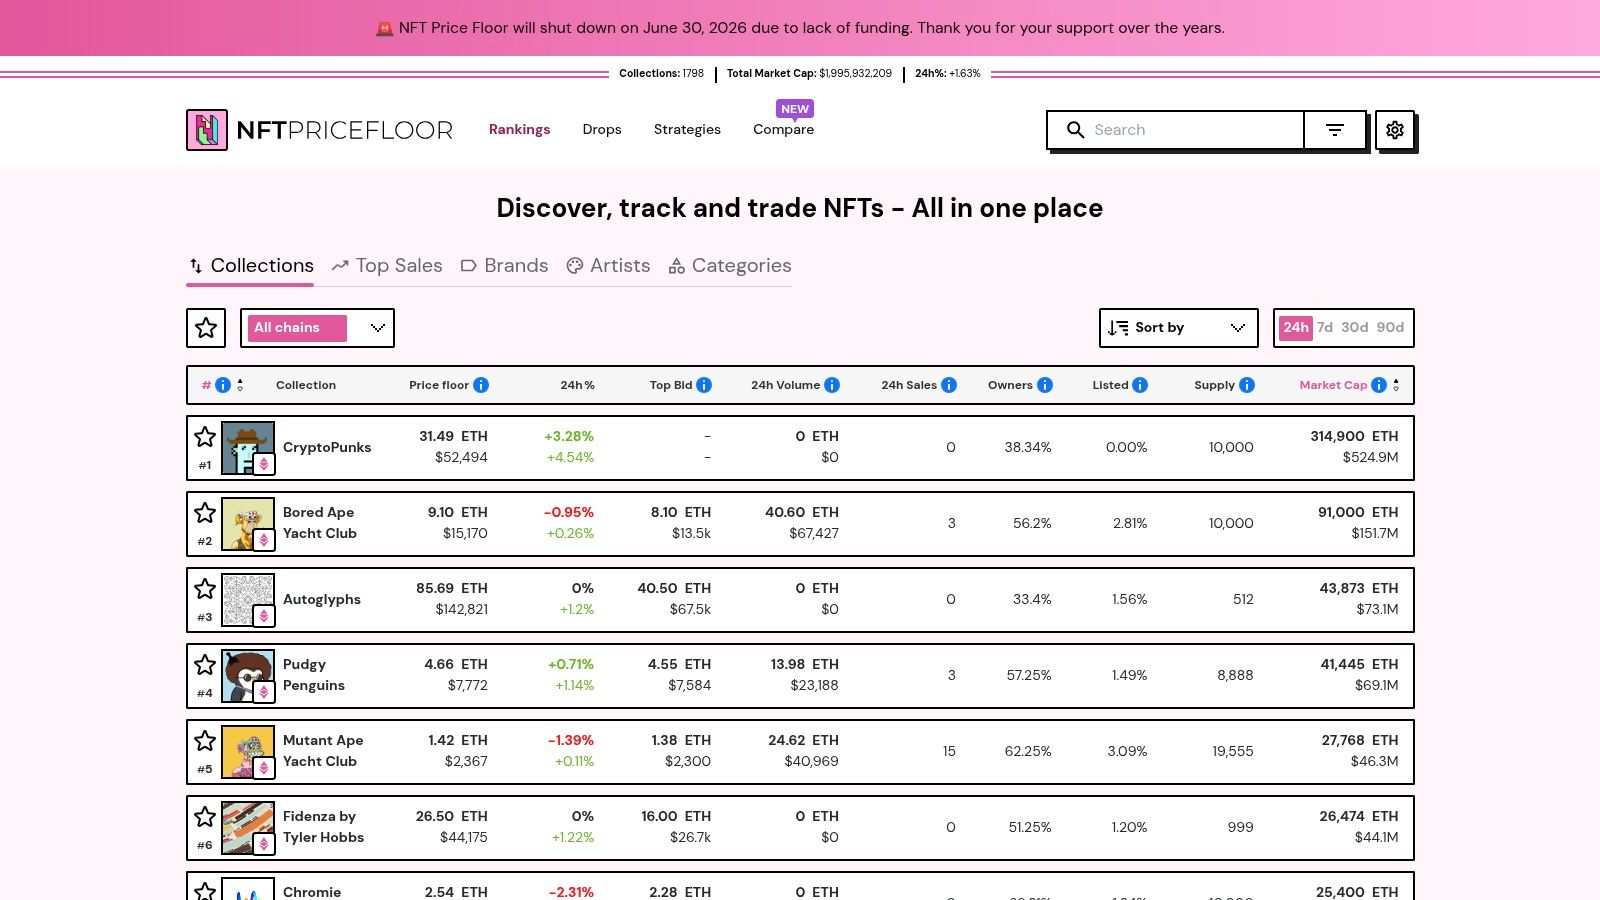
The NFT price floor is the lowest active listing price for an NFT in a collection, and in a market now worth $1.41 billion with $942 million in daily sales volume, that number matters because it sets the visible entry point into a collection. But if you treat it as the asset's “real value,” you'll misread liquidity, miss manipulation, and make the same mistake that catches new traders in thin markets.
The most popular advice on NFT floors is also the most dangerous: “just watch the floor.” That's incomplete. The floor is a useful signal, but it's only the first layer of analysis. Professional traders care just as much about whether that floor is executable, whether it's being shaped by a whale, and whether the collection type itself changes how the floor should be interpreted.
In Web3, simple metrics often hide complex market structure. Tokenomics can distort incentives. Smart contracts can create automated listing behaviors. Layer 2 activity can shift trader attention across ecosystems. AI-driven analytics can improve detection, but they can also amplify herd behavior when everyone chases the same dashboard alerts. If you want to read an NFT market like an analyst instead of a spectator, you need to treat the NFT price floor as a starting point, not a verdict.
Table of Contents
- Beyond the Lowest Price Tag
- What an NFT Price Floor Actually Is
- How the Real Price Floor Is Calculated
- Interpreting Floor Price Movements Like a Pro
- The Dark Side Price Manipulation and Hidden Risks
- Top Tools for Tracking NFT Price Floors in 2026
- Your Next Steps in NFT Analysis
Beyond the Lowest Price Tag
A floor price looks precise, which is exactly why it fools people.
For newer NFT buyers, the lowest listing often feels like a valuation shortcut. Professional traders treat it more like a stress signal. It shows the cheapest visible exit point for a seller, but it says little on its own about liquidity, buyer conviction, or how easily that number can be pushed around by a small set of wallets. In a market that CoinGecko still tracks as active and large enough to rotate capital quickly between collections, that distinction matters.
The mistake is assuming the floor measures value. In practice, it measures the thinnest part of the ask side. One listing can set the headline price for an entire collection, even if almost no one is willing to transact near it. That gap between displayed price and executable market is where many bad NFT trades begin.
Anyone still learning the market structure behind collections, wallets, and contract-level supply should first review how NFTs work at the protocol and marketplace level. Without that foundation, floor data is easy to misread.
Why the floor misleads smart people
NFTs do not trade on the kind of deep order books token traders expect. Supply is fragmented across traits, marketplaces, and holder types. A higher floor can reflect genuine demand, but it can also come from cheap listings getting pulled, a single sweep clearing a thin wall, or large holders refusing to list. A lower floor can signal panic, but it can also come from one motivated seller needing immediate liquidity.
That is why experienced analysts separate price visibility from market quality.
The floor works best as a context-dependent signal, not a standalone valuation model.
A collection with a 3 ETH floor and weak bids may be less liquid than a collection with a 2.6 ETH floor and dense bid support. New investors often miss that because listings are public and easy to screenshot, while liquidity underneath them takes more work to inspect.
What professionals read alongside it
Serious NFT traders usually test the floor against a small set of market checks before they trust it:
- Depth near the floor: A stack of listings within a narrow band usually matters more than one isolated ask.
- Bid support: Active bids close to the floor show whether buyers are prepared to transact, not just watch.
- Seller concentration: If a few wallets control a large share of near-floor supply, the visible market can shift fast.
- Listing turnover: Fresh repricing often signals active participation. Old untouched asks can distort the picture.
- Trait dispersion: In some collections, the nominal floor sits on undesirable items that do not represent broader demand.
That is where a significant edge appears. The floor gives you the headline. Trade quality shows up in the structure underneath it.
What an NFT Price Floor Actually Is
For beginners, the cleanest analogy is this: the NFT price floor is the entry ticket to a collection. If you want exposure to a project without paying up for rare traits, the floor tells you the cheapest visible route in.
The simplest working definition
The floor price is defined specifically as the lowest active listing price, or the cheapest ask, for an NFT in a collection. If the lowest listing is 2 ETH, the floor price is exactly 2 ETH, regardless of higher listings or average sale prices, as explained in Gate's NFT floor price guide.
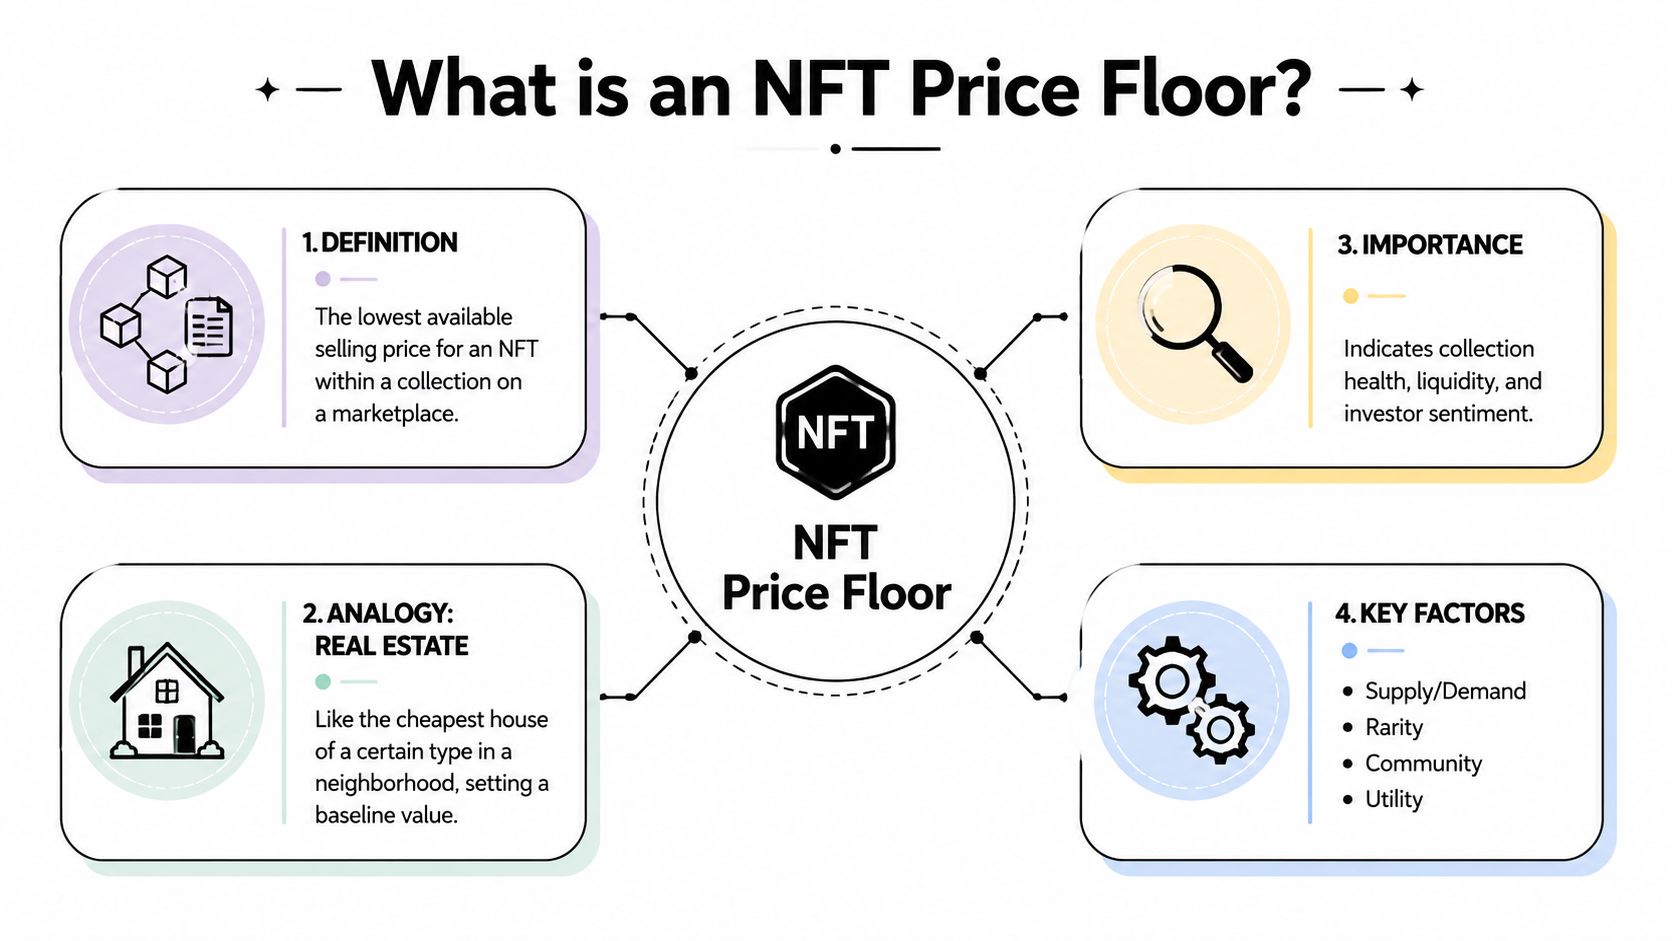
That's why the floor isn't an average. It isn't a median. It isn't the last sale. It's a live ask sitting on the market right now.
If you're still learning the mechanics behind digital ownership, wallets, and collection contracts, a simple primer on how NFTs work in practice helps connect floor prices to the smart-contract structure underneath them.
Why traders care about one number
The floor compresses a messy collection into one benchmark. It strips out most in-collection differences and gives buyers a baseline answer to a practical question: “What's the cheapest visible way to join this market?”
That simplification is powerful for three reasons:
- Accessibility: New buyers don't need to understand every trait ranking before they gauge affordability.
- Sentiment: A healthy floor often signals that sellers believe they can hold the line.
- Baseline valuation: At the collection level, the floor offers a rough starting point for fair market value by ignoring rarity complexity and focusing on minimum entry.
Coinbase's explanation of NFT floor pricing captures that role well. The floor streamlines decision-making because it removes trait-by-trait noise and leaves a single number that approximates the cheapest path into the project.
Practical rule: Use the floor to understand accessibility and baseline sentiment. Don't use it alone to estimate what you can exit at.
That distinction matters more in NFTs than in many DeFi tokens. In fungible markets, large pools and Layer 2 execution can tighten spreads. In NFTs, every item is discrete, every seller has a strategy, and every “cheap” listing may carry hidden context. The floor is simple by design. Reading it well is not.
How the Real Price Floor Is Calculated
The floor you see on a serious analytics dashboard usually isn't pulled from a single marketplace tab. Reliable platforms build a broader view because NFT liquidity is fragmented across venues, and one venue can show a distorted picture.
Why one marketplace view isn't enough
Expert analytics platforms calculate floor price by aggregating data across multiple major marketplaces and often incorporate historical averages, like the mean of the 5% lowest-priced sales over 30 days, to smooth volatility and improve trend analysis, according to CCN's breakdown of NFT floor price calculation.
That changes how you should think about the metric.
A raw marketplace floor is a snapshot. An analytics floor is often a filtered benchmark. Both are useful, but they answer different questions:
| View | What it tells you | Main weakness |
|---|---|---|
| Single marketplace lowest ask | The cheapest live listing on that venue | Can be skewed by one outlier |
| Aggregated marketplace floor | The broadest visible entry point across venues | Still depends on live asks |
| Smoothed analytical model | Trend direction and low-end market behavior | Less precise for immediate execution |
If you want a parallel from broader trading mechanics, price discovery in crypto markets works the same way. The visible price is one layer. The process that forms it is the deeper signal.
How serious dashboards smooth the noise
The use of historical averaging is where many retail traders lose the plot. They assume “floor” means one live number. Professional dashboards often care about whether the cheapest slice of the market is strengthening over time.
That's useful because NFT markets are noisy by nature:
- One desperate seller can print a lower visible floor.
- One removed listing can make the floor jump without a real wave of buying.
- Cross-market fragmentation can hide the true cheapest ask from traders who only monitor one venue.
A more robust floor model tries to answer a harder question: what is the lower end of this collection doing consistently, not just this second?
When low-tier sales strengthen over time, the floor becomes more credible. When only the visible ask changes, treat the move with caution.
This is also where AI-assisted market tooling is becoming more relevant. Pattern recognition can flag abrupt changes in low-end listings faster than manual scanning. But the judgment still belongs to the trader. Algorithms can identify anomalies. They can't tell you whether the anomaly reflects conviction, distress, or manipulation without broader context.
The key takeaway is simple. The “real” NFT price floor isn't a magic number. It's a benchmark produced from marketplace data, listing behavior, and sometimes historical smoothing. The better the method, the less likely you are to chase a false signal.
Interpreting Floor Price Movements Like a Pro
A floor chart doesn't tell a single story. It tells different stories depending on the collection's age, community structure, supply distribution, and narrative relevance. The same move can mean confidence in one project and weakness in another.
What a rising or falling floor usually means
A rising floor usually suggests that sellers are gaining confidence or that buyers are willing to absorb cheaper supply. A falling floor often means undercutting pressure is building. A flat floor can signal consolidation, indecision, or a standoff between patient sellers and selective buyers.
The useful question isn't “did the floor move?” It's “who caused the move, and what sits behind it?”
Consider these readings:
- Rising floor with active buying: Often a stronger signal, because low listings are getting cleared.
- Rising floor with weak trade follow-through: Often a warning sign, because supply may have been pulled rather than bought.
- Falling floor with steady bids: Sometimes healthy repricing, especially after hype.
- Falling floor with vanishing interest: Often the early sign of a deeper liquidity problem.
- Stable floor with tight listing clusters: Can indicate a market finding temporary balance.
A floor works a lot like support in technical analysis, except it's less clean because each NFT is non-fungible. If you already use chart structure in crypto, the logic behind support and resistance levels maps surprisingly well to collection floors. The difference is that NFT support can disappear fast when sellers crowd the same price band.
Don't interpret a floor move in isolation. Look for confirmation in bids, listing density, and recent sale quality.
Why collection type changes the reading
One common pitfall for amateurs involves flattening everything into one framework. A historic collection should not be read the same way as a fresh mint, a gaming NFT, or an AI-themed experimental drop.
Historic NFT collections currently hold the #2 ranking in NFT category rankings with an aggregated market cap of $732,534,403 USD, according to NFT Price Floor's historic collections category data. That matters because category structure affects floor behavior.
Historic collections often show more resilience for qualitative reasons that are easy to underestimate:
- Collector identity: Holders often see themselves as curators, not flippers.
- Narrative durability: Historical significance can outlast short-term hype cycles.
- Community memory: Established communities may defend pricing psychologically, even during broader weakness.
A newer collection behaves differently. It may react more sharply to roadmap announcements, tokenomics changes, influencer attention, Layer 2 migration, or a shift in marketplace incentives. In those cases, the floor is more sensitive to momentum and less anchored by legacy status.
A trader's reading framework
Use this checklist before assigning meaning to a floor move:
- Check the collection type. Historic, PFP, gaming, art, membership, and utility NFTs don't behave the same way.
- Study nearby listings. One floor listing means little. A thick band of asks near the floor means more.
- Watch how fast the low end refreshes. Fast turnover suggests active price discovery.
- Compare narrative strength. Is the collection tied to a live Web3 trend such as DeFi access, AI identity layers, or tokenized communities?
- Ask what changed off-chain. Sometimes Discord sentiment, roadmap execution, or creator credibility matters more than the chart.
Professionals don't just track where the floor is. They track what kind of floor it is.
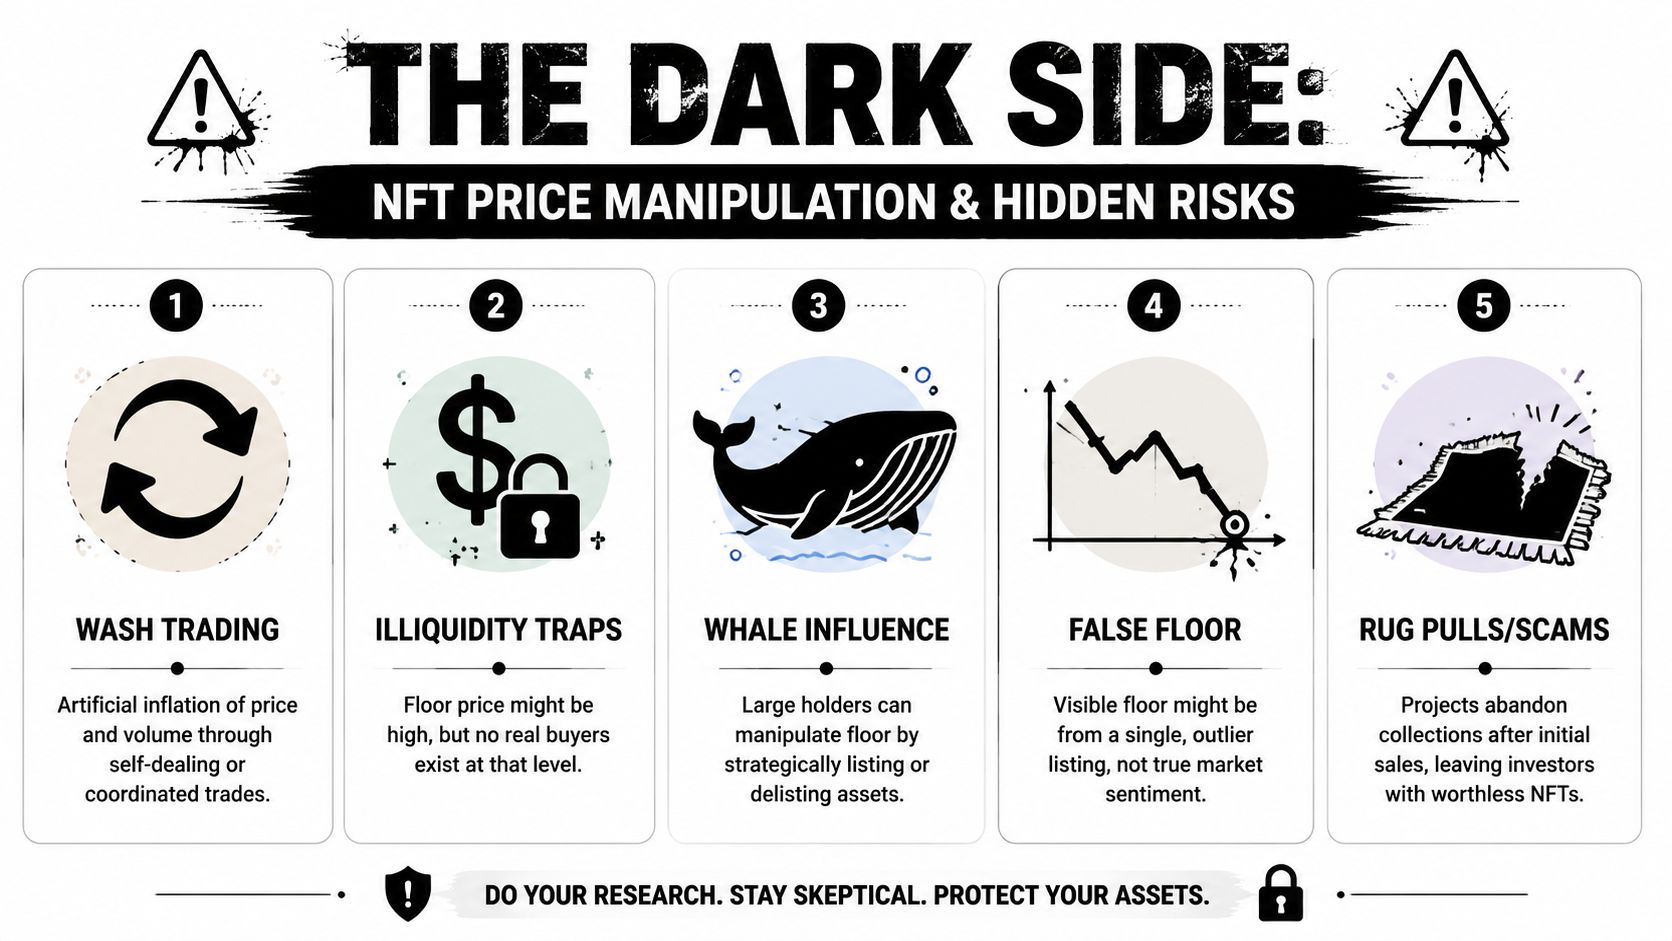
The Dark Side Price Manipulation and Hidden Risks
The biggest mistake in NFT analysis is assuming the visible floor is the price you can realize. In thin markets, that assumption breaks fast.
The liquidity trap most beginners miss
The floor is based on active asks, not completed sales. That means it can reflect seller intention more than executable reality. Cube Exchange's explainer on floor price mechanics highlights this distinction clearly. The cheapest listing may define the floor mathematically, but it may never fill.
That gap between the visible floor and the executable price is where many losses begin. Traders buy because the floor “looks strong,” then discover there's no real bid support when they try to exit. The number on screen was real. The liquidity behind it wasn't.
There's a second problem. Manipulators know that many traders anchor on the floor as a “safe” benchmark. Recent data from 2025 indicates that over 30% of top NFT collections experienced artificial floor depression events led by coordinated whale activity. That doesn't mean every weak floor is manipulated. It means floor behavior deserves verification before you trust it.
A practical verification checklist
You don't need institutional tooling to defend yourself. You do need discipline.
Use this protocol before treating a floor as meaningful:
- Check owner concentration. If a small group of wallets controls a large chunk of supply, they can reshape the visible market quickly.
- Inspect bid-to-ask behavior. A floor with weak bids underneath it is vulnerable.
- Look for volume anomalies. Sudden activity without a clear narrative can signal coordinated behavior.
- Study listing spacing. If one listing sits far below the rest, it may be bait, distress, or manipulation.
- Review sale recency. A stale floor in a quiet market is less informative than a live floor with recent transactions.
A security mindset matters here as much as a market mindset. If you trade speculative collections, a practical guide to avoiding common crypto scams is relevant because manipulation rarely appears in isolation. It often travels with fake urgency, fake community signals, and fake confidence.
A visible floor is a quote. An executable market needs buyers.
The whale problem most guides ignore
Whales can influence floors in two opposite directions.
They can sweep the floor to trigger fear of missing out and create momentum. Or they can undercut the floor to create panic, force weaker holders to reprice, and accumulate later under better conditions. Both tactics exploit the same weakness. Traders over-trust a single visible number.
AI plus crypto cuts both ways. Automated alert tools can spot abrupt floor changes sooner than humans can. They can also accelerate herd reactions to manufactured moves. Faster information doesn't automatically produce better interpretation.
The defensive edge is simple: verify depth, verify bids, verify holder structure. If the floor survives those checks, it becomes useful. If it doesn't, treat it as theater.
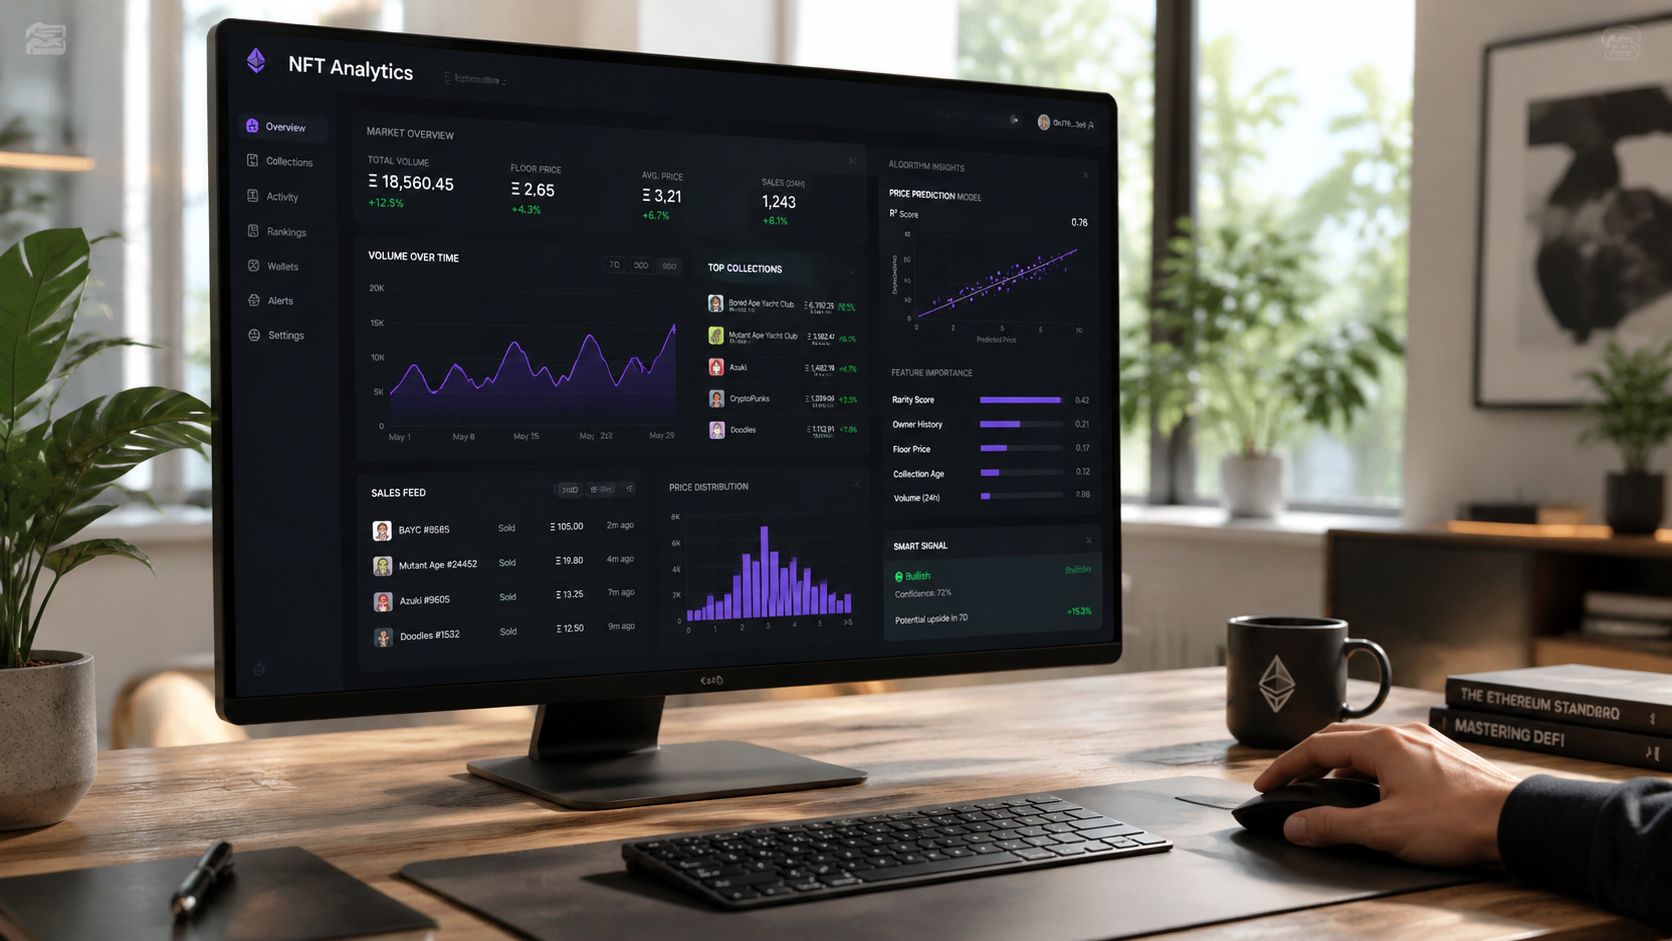
Top Tools for Tracking NFT Price Floors in 2026
A floor tracker is only useful if it helps you distinguish a real market from a quoted market. Newer traders often treat dashboards as neutral scoreboards. They are not. Each platform emphasizes a different layer of the market, and that choice shapes what you see first, what you miss, and how quickly you spot stress.
A useful starting point is a direct market view:
What each tool does best
The best stack usually combines three views. A fast read on listed floors. On-chain context around wallets and flows. Portfolio monitoring that shows how your own exposure is changing in real time.
| Tool | Key Feature | Best For | Website |
|---|---|---|---|
| NFTPriceFloor | Category views and collection floor tracking | Collectors who want fast market scans | NFTPriceFloor |
| Nansen | Wallet behavior and smart money analysis | Traders focused on on-chain context | Nansen |
| WGMI.io | Portfolio and collection monitoring | Active NFT participants tracking multiple holdings | WGMI |
| CoinGecko NFT | Broad NFT market overview | Readers who want ecosystem-level context | CoinGecko NFT |
NFTPriceFloor is useful for speed. It helps you compare collections, scan category rotation, and catch abrupt repricing without opening several marketplaces. That makes it a good first screen, but not a final decision tool. A collection can show a stable floor on an aggregator while actual marketplace liquidity is thin.
Nansen answers a different question. Instead of asking where the cheapest listing sits, it helps you examine who is buying, listing, or exiting around that level. That wallet layer matters because a floor supported by dispersed buyers looks very different from one shaped by a few repeat actors or concentrated holders.
WGMI.io is more operational. If you hold multiple NFTs across ecosystems, it reduces the friction of tracking cost basis, watchlists, and changes in collection values from one interface. Traders who also hold fungible assets may want a broader stack, which is why lists of crypto portfolio trackers for multi-asset monitoring can be useful alongside NFT-specific tools.
CoinGecko NFT works best as a high-level reference point. As noted earlier, it gives ecosystem context, but broad coverage is not the same as tradeable precision. Use it to orient yourself. Use collection-specific and wallet-level tools to verify what the headline number means.
One more resource is worth watching for visual learners:
Building a practical workflow
Professionals usually move from broad signal to specific verification.
- Scan for market shifts: Start with an aggregator to identify collections with sudden floor moves, unusual category strength, or abnormal listing changes.
- Check market quality: Open the collection on its main marketplace and inspect listing depth, bid support, and recent sales near the displayed floor.
- Add wallet context: Use on-chain analytics to see whether activity is coming from genuine breadth or a small set of influential wallets.
- Track your own exposure: Monitor portfolio changes so you can separate a market-wide move from collection-specific deterioration.
Tool choice is strategy choice. A collector looking for entries needs speed and clean alerts. A trader managing risk needs holder concentration, sales recency, and bid quality in the same workflow. The edge comes from combining those views before you treat the floor as actionable.
Your Next Steps in NFT Analysis
The NFT price floor is one of the most useful metrics in crypto, and one of the most misread. It gives you the lowest visible entry into a collection, but it doesn't automatically give you fair value, exit liquidity, or proof of healthy demand.
That's why good analysis starts with the floor and then moves outward. Check how the number is formed. Check who may be shaping it. Check whether the market around it is tradable. The most important risk to remember is the gap between the lowest ask and the executable price. In thin markets, the floor can reflect seller hope more than realizable value, and that's exactly how liquidity traps form.
The floor is a signal. Your job is to test whether the market underneath it is real.
This skill is getting more relevant, not less. As NFTs intersect with DeFi, lending, gaming, identity, and tokenized real-world assets, baseline pricing metrics will matter across more use cases. If a protocol accepts NFTs as collateral, floor stability becomes a risk parameter. If real-world assets become tokenized into more granular on-chain markets, traders will face similar questions about visible price versus executable value. Layer 2 scaling will likely make these markets faster. AI analytics will make them more searchable. Neither will remove the need for judgment.
Use the floor to get oriented. Use market structure to make decisions. That's how you stop reading NFT dashboards like a shopper and start reading them like an analyst.
If you want more clear, evidence-based breakdowns of NFTs, DeFi, Web3, tokenomics, and emerging blockchain trends, explore Coiner Blog. It's a strong resource for readers who want practical crypto analysis without the usual hype.