Cryptocurrency ramblings
Mastering Support Resistance Levels in Crypto Trading
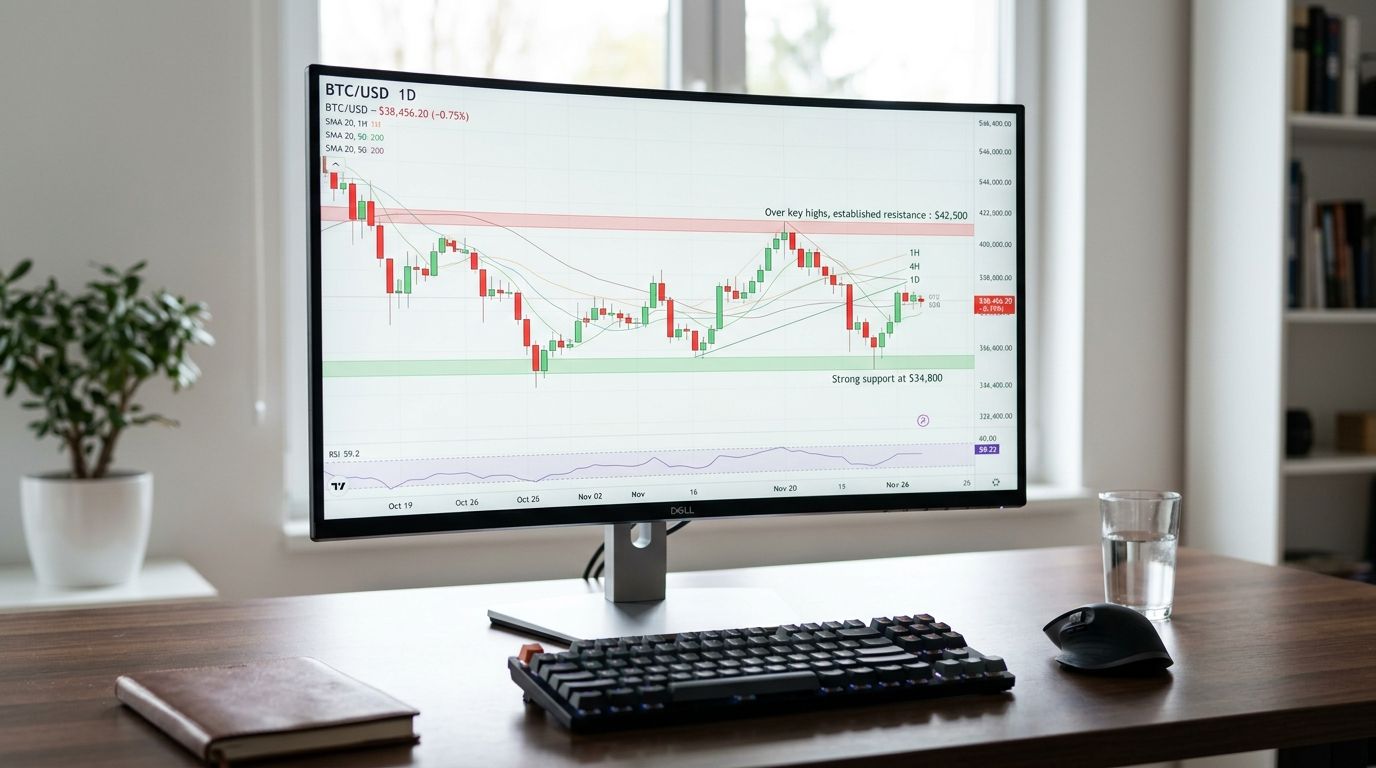
You're probably looking at a Bitcoin or ETH chart right now, seeing price slam into a level, reverse hard, and wondering why that spot mattered so much. It looks random until you mark the chart properly. Then the move stops looking like chaos and starts looking like order flow, liquidity, and memory.
That's why support resistance levels still matter, even in a market shaped by perpetual futures, bots, DeFi liquidity, Layer 2 narratives, tokenomics, and AI-driven trading tools. Crypto trades around the clock. News hits at any hour. A token can trend because of a smart contracts upgrade, a Web3 partnership, or a real-world asset tokenization headline. But price still reacts to areas where buyers and sellers previously fought.
Most beginners draw one thin line and expect the market to obey it. That's not how experienced traders use support resistance levels. The useful approach is wider, more contextual, and much more selective. The edge comes from combining higher-timeframe zones with dynamic levels like VWAP and volume profile, then waiting for confirmation instead of guessing.
Table of Contents
- Why Some Crypto Prices Seem Like Magic Walls
- Decoding the Battle Between Buyers and Sellers
- From a Blank Chart to an Actionable Map
- Reading the Markets Next Move at Key Levels
- Beyond Horizontal Lines Advanced S-R for Crypto
- Trading the Levels Without Wrecking Your Portfolio
- Your Crypto Support and Resistance Cheat Sheet
Why Some Crypto Prices Seem Like Magic Walls
Bitcoin pushes above a clear intraday high, Crypto Twitter starts calling for continuation, and ten minutes later price is back inside the range. That sequence happens so often in crypto that newer traders label it manipulation. In practice, it is usually a level test that failed because buyers could not hold price above an area where sellers were already waiting.
Support and resistance explain a large share of those sharp reactions, but the useful part is not the textbook version with a few static lines drawn across old highs and lows. In crypto, levels behave more like zones of pending business. They form around prior auctions, heavy volume, liquidation clusters, session VWAP, and high-volume nodes that keep attracting order flow long after the first move is over.
That is why a level can look almost supernatural on the chart, then fail instantly on the next touch. The line itself is not magic. The reaction depends on context. Was there real acceptance above the area, or just a wick through resistance? Did price reclaim the daily VWAP, or did it bounce into a falling value area high and stall? In a 24/7 market, those details matter more than the line.
Crypto also exaggerates every test. A level built during New York hours can get swept during Asia, then reclaimed in Europe. Perpetual futures add funding pressure, liquidations force price through obvious zones, and fragmented liquidity means one exchange can overshoot a level while another barely tags it. That is why traders who rely only on horizontal lines often get chopped up. The better approach is to treat old highs and lows as reference points, then confirm them with live signals such as volume behavior, VWAP positioning, and how quickly price is accepted or rejected around the zone.
If you are trying to figure out why a clean support level suddenly breaks anyway, broader risk conditions often explain the move better than the chart alone. This breakdown of why crypto is crashing right now is a useful companion, because levels work best when they are read alongside macro pressure, positioning, and sentiment.
Markets do not reverse at random as often as frustrated traders think. They usually react where liquidity, trapped traders, and unfinished auction business are already sitting.
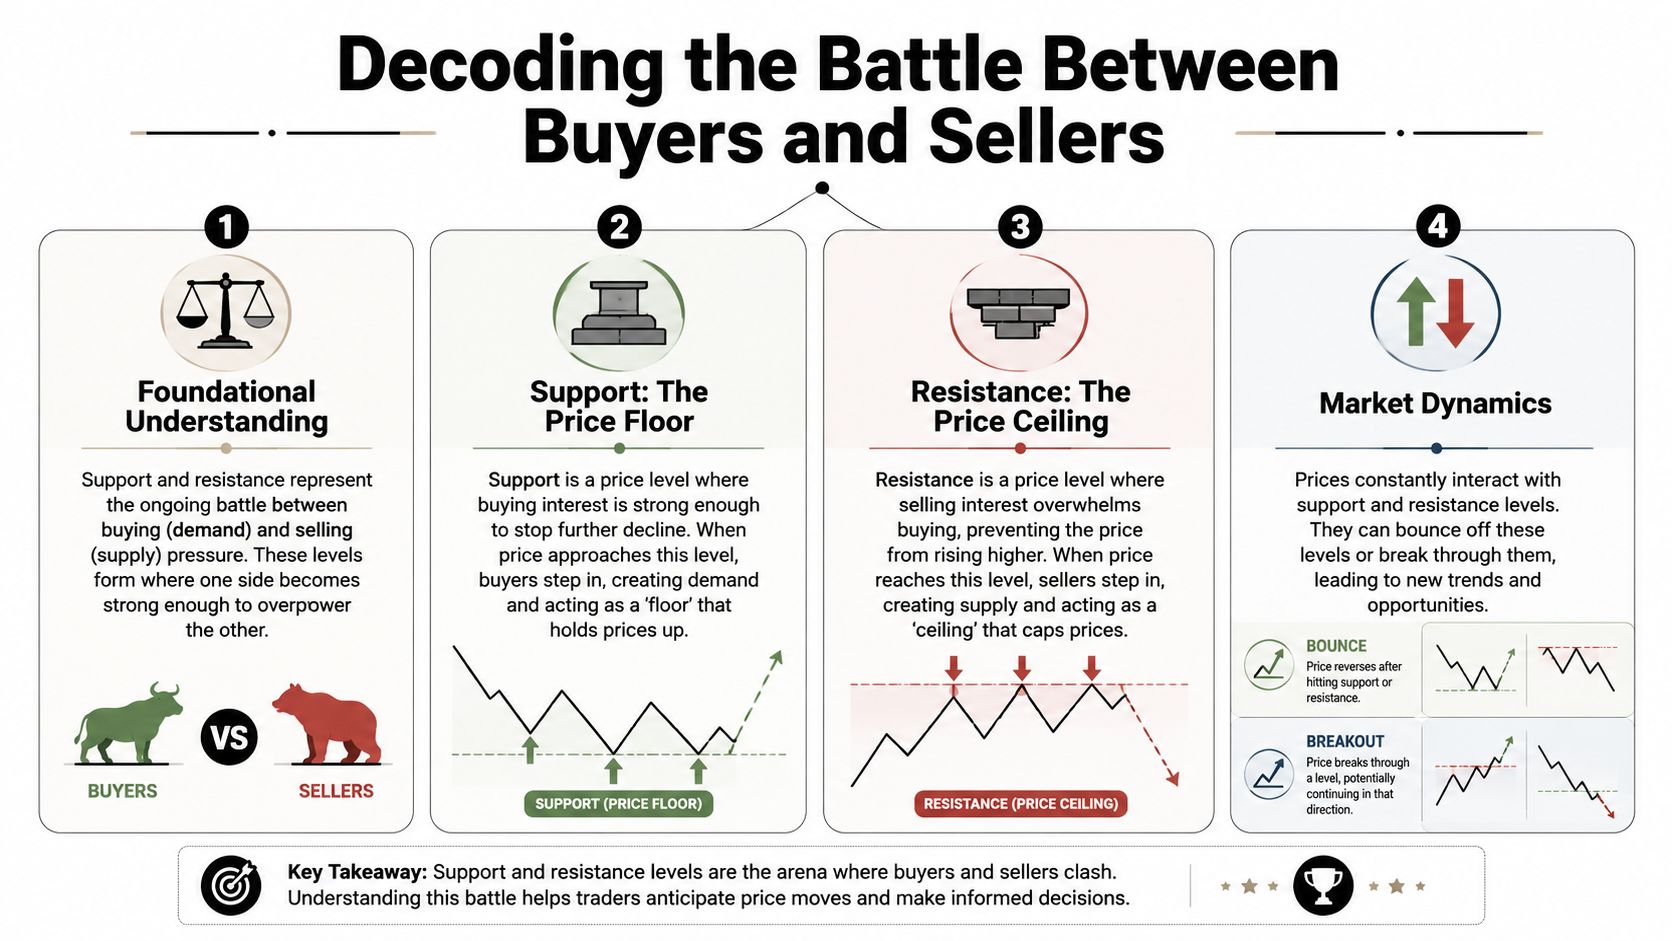
Decoding the Battle Between Buyers and Sellers
Support and resistance map buyer urgency against seller urgency. On a chart, they show where one side has repeatedly gained control long enough to force a reaction.
Why traders keep reacting at the same places
A support zone forms where bids keep absorbing sell pressure. A resistance zone forms where offers keep capping upside. In crypto, those areas are rarely random. They often line up with a prior liquidation sweep, the edge of a range, a high-volume node, or a session VWAP that large traders are watching in real time.
That last part matters. Static horizontal levels still help, but in a 24/7 market they work better when they line up with dynamic references. If BTC revisits a prior breakout area while holding above daily VWAP and building volume at the same price band, buyers have a stronger case. If the same level is tested below VWAP and inside a weak auction, the odds of failure rise.
A market with strong cryptocurrency liquidity usually gives cleaner reactions because there is enough participation to show whether the zone is being defended. Thin books can still respect a level, but they also produce fake breaks, sharp wicks, and fills that look good on the chart and terrible in execution.
Repetition gives a level weight, but context decides whether that weight holds.
A broken resistance can become support on the retest. Traders call it a flip, and it works because positioning changes around the old barrier. Shorts who sold there are under pressure. Breakout buyers want confirmation. Dip buyers see a defined invalidation point. That cluster of incentives can create a real defense, not just a line drawn after the fact.
The role reversal that traps late traders
The common mistake is treating every breakout as acceptance. Price can trade above resistance for a few minutes, trigger breakout entries, and still fail if buyers do not hold the area on the retest.
The sequence is usually straightforward:
- Initial rejection: Price tags resistance and sellers respond.
- Break higher: Shorts cover and momentum traders chase the move.
- Retest: Price returns to the breakout zone.
- Acceptance or failure: Buyers either absorb supply and hold the level, or price slips back into the prior range.
That final step matters more than the breakout candle. On ETH, for example, a push above range highs during the U.S. session can look strong, then fade overnight if volume dries up and price loses VWAP. On SOL or lower-liquidity altcoins, the same pattern can fail even faster because perp positioning and thinner order books exaggerate both squeezes and reversals.
Practical rule: Mark the zone, then judge the retest. If price reclaims the level, holds above it, and volume supports the move, the flip is tradable. If price pokes above, stalls, and accepts back inside the old range, treat it as a failed auction, not fresh support.
From a Blank Chart to an Actionable Map
A blank chart is better than a cluttered one. Most traders ruin support resistance levels by drawing too many lines and treating every minor wiggle like a landmark.
Start with the weekly and daily
The cleanest process starts from higher timeframes. Support and resistance are best treated as zones, not exact prices, and a good practice is to connect at least 3 price-action zones spaced in time. Levels that appear on longer timeframes and align with shorter ones are stronger (Zerodha on support and resistance zones).
That's the foundation. On Bitcoin, I begin with the weekly to mark obvious swing highs, swing lows, and long consolidations. Then I drop to the daily and tighten those broad areas into usable zones.
Look for these first:
- Major swing highs and lows: These are the clearest memory points on the chart.
- Consolidation edges: The top and bottom of a range often matter more than the middle.
- Breakout origins: Where a strong directional move began, someone was offside.
- Repeated reaction areas: If price has defended or rejected a zone several times, keep it.
Refine the zones on lower timeframes
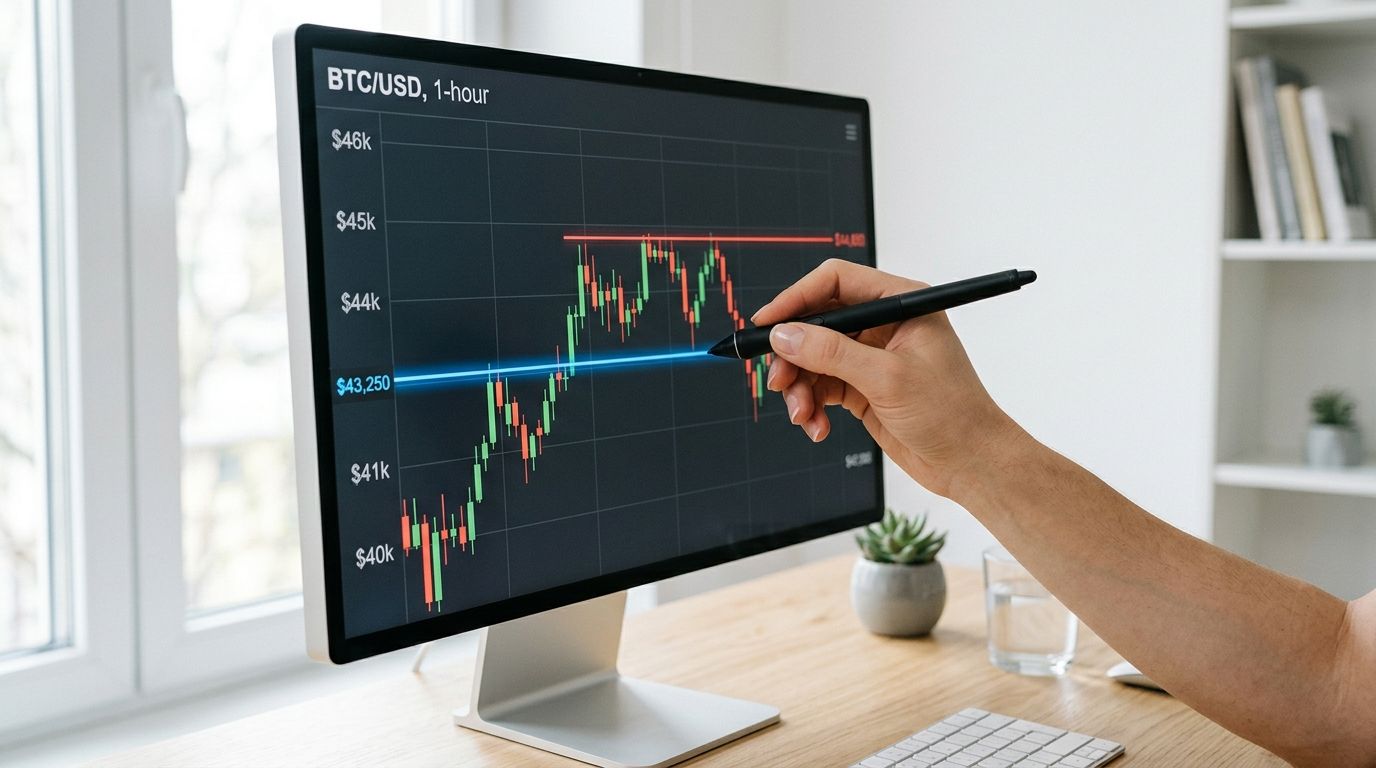
Once the macro map is done, move to the 4-hour and 1-hour charts. Here, support resistance levels become tradable instead of academic.
Use the lower timeframe for precision, not for invention. Don't redraw the whole chart from scratch. Refine the higher-timeframe zones by identifying where intraday candles rejected, accepted, or failed.
A few practical rules help:
- Draw boxes, not razor lines. Crypto often overshoots by a bit, then reverses.
- Prioritize areas with multiple touches. One touch can be luck. Repeated touches deserve attention.
- Keep only the levels you'd trade. If you wouldn't place risk around it, delete it.
- Check confluence. A daily support zone that also matters on the 4-hour is far more useful than a random 15-minute pivot.
Here's a useful walkthrough if you want to see chart marking in action:
A simple workflow for Bitcoin and Ethereum
For BTC and ETH, I use a repeatable routine.
| Step | What to mark | What I'm asking |
|---|---|---|
| Weekly | Major highs, lows, range boundaries | Where did trend direction clearly change? |
| Daily | Tested zones and breakout shelves | Which areas keep pulling price back? |
| 4-hour | Entry zones and local structure | Where could a retest become tradable? |
| 1-hour | Execution detail | Is price accepting or rejecting the area right now? |
This works well across sectors too. A Layer 2 token, a DeFi governance token, and a real-world asset token won't all move for the same reason, but they still leave the same chart footprints. The story might be smart contracts adoption or AI-crypto integration. The execution still comes back to where buyers and sellers previously committed size.
Reading the Markets Next Move at Key Levels
Finding a level is only step one. The key advantage is reading what price does when it gets there.
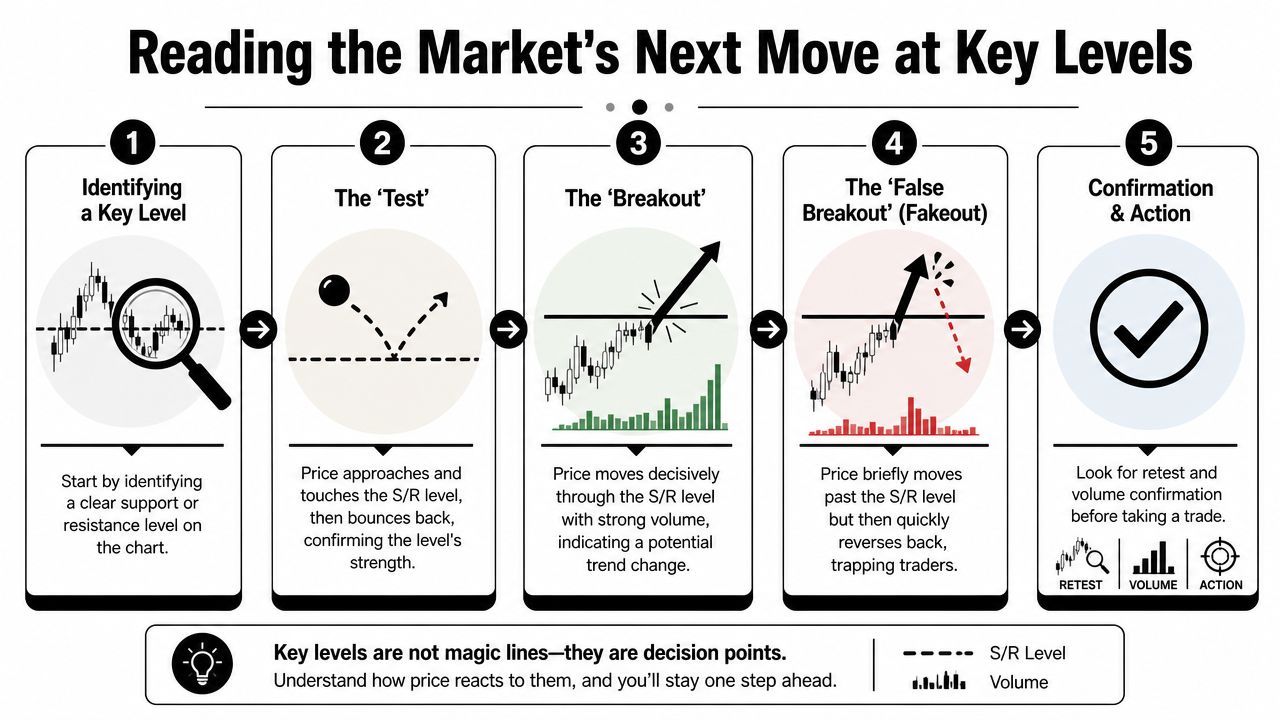
A test is not a breakout
A test means price reaches a level and reacts. A breakout means price moves through it with enough conviction that the market starts accepting value on the other side. A fakeout means price briefly trades beyond the level, triggers traders in one direction, then reverses back.
That distinction matters more in crypto than many beginners realize. A candle poking above resistance isn't enough. You want to see follow-through, ideally with stronger participation and a retest that holds. If the move can't hold above the zone, it often means the market just ran liquidity.
I think in terms of questions, not predictions:
- Did price reject the level fast? Long wicks often signal rejection.
- Did candles close through the zone? Closes matter more than intrabar pokes.
- Did the market retest and hold? Retests separate impulse from acceptance.
- Is the move aligned with the broader trend? Countertrend breakouts fail more often.
For traders who like a more systematic lens, PlotStudio AI for time series insights is a useful resource for thinking about trend behavior, regime shifts, and how noisy markets differ from directional ones.
What acceptance and rejection look like
Rejection often looks sharp. Price tags the zone, leaves a wick, then trades away. Acceptance usually looks slower and more convincing. Price pushes through, stays there, and starts building structure above or below the old level.
Candlestick patterns help, but they only matter when they appear in the right place. A pin bar in the middle of nowhere isn't special. A pin bar into a major weekly resistance zone gets my attention. Same with engulfing candles. Location first, pattern second.
The break-and-retest setup is still one of the cleanest entries in crypto because it forces price to prove itself before you risk capital.
I also pay attention to whether price action matches the plan described in many crypto trading strategies. If the market keeps failing to hold above broken resistance, the breakout thesis is weak, no matter how attractive the narrative sounds.
Beyond Horizontal Lines Advanced S-R for Crypto
Horizontal zones matter, but crypto isn't a market where static levels alone are enough. It trades all day, all week, across many venues, with fragmented liquidity and fast shifts between spot, futures, and onchain catalysts.
Why static levels are not enough in crypto
In a 24/7 market like crypto, advanced traders use intraday pivot levels, VWAP bands, and volume-profile ledges that update with order flow. VWAP bands can act as dynamic support and resistance, while volume profile highlights where the most trading occurred, creating strong zones (NinjaTrader on intraday support and resistance).
That changes how support resistance levels should be used. A weekly horizontal support may still be the anchor, but intraday execution often comes from dynamic tools:
- VWAP: Useful for judging whether intraday price is trading around fair value or getting stretched.
- Volume profile ledges: Strong for identifying shelves where the market previously did a lot of business.
- Pivot levels: Helpful for shorter-term reaction points in active sessions.
- Anchored event analysis: Especially useful after major catalysts like ETF headlines, token vesting discussions, or protocol launches.
In crypto, this matters because obvious highs and lows often become liquidity magnets. The market may tag a static line, sweep stops, and only then react at a nearby dynamic level.
How to combine horizontal zones with dynamic tools
The best charts blend both worlds. Start with the static zone from the higher timeframe. Then ask how intraday order flow is behaving inside it.
A practical stack looks like this:
- Higher timeframe box: Weekly or daily support or resistance.
- VWAP position: Is price trading above or below intraday fair value?
- Volume profile ledge: Is there a high-volume shelf inside the zone?
- Trigger candle: Did the market reject, accept, or fail at that exact area?
That combination is far better than blindly buying every support or shorting every resistance. It's especially useful for traders active in perpetuals, structured products, or cryptocurrency options trading, where timing and level quality matter more than broad directional bias.
This is also where modern crypto themes matter. A token tied to Layer 2 scaling, DeFi lending, or tokenized real-world assets can have a strong narrative and still trade poorly if price is below VWAP, under a daily breakdown level, and stuck beneath a volume-profile ledge. Good stories don't rescue bad location.
Trading the Levels Without Wrecking Your Portfolio
Support resistance levels don't make money by themselves. Entries, exits, and risk control do. Traders who know where the level is but don't know where they're wrong still lose.
Range trading playbook
Range trading works when price is rotating between clear support and resistance and not accepting outside the range.
The basic long setup is simple. Buy near support after rejection is visible. The short setup is the mirror image near resistance.
What matters is structure:
- Entry: Wait for rejection inside or just beyond the zone.
- Invalidation: Place the stop where the trade idea is clearly wrong, not where it feels comfortable.
- Target: Aim for the other side of the range or the next obvious trouble area.
- Pass condition: If price is chopping in the middle, there's no edge.
Breakout trading playbook
Breakout trading is harder than it looks because many breakouts are just liquidity grabs. The cleaner version is the break and retest.
For a bullish breakout, I want price to close through resistance, hold above it, and then defend the retest. For a bearish breakout, I want the opposite sequence below support. The first move gets attention. The retest gets the trade.
A stop belongs beyond the retest failure point, not deep inside the old range. If price can't hold the new area, the thesis has probably failed.
When levels fail hard
Support and resistance fail when they become too obvious, too crowded, or too disconnected from the broader trend. Crowded levels can become liquidity targets, and a simple touch-based bounce is a costly assumption in volatile crypto. A level carries more weight when it aligns with broader structure and shows real acceptance or rejection after a break (Fidelity on when support and resistance fail).
That's why stop placement matters so much. If you need a practical guide, this article on how to set stop losses is worth keeping nearby. The best support resistance levels in the world won't save a trader who sizes too large and places stops exactly where every other retail trader places them.
A level is only useful if you already know what price behavior confirms the trade and what price behavior cancels it.
Your Crypto Support and Resistance Cheat Sheet
A cheat sheet should help you make faster decisions, not repeat the theory you already studied. On a live crypto chart, the job is simple. Find the level that matters, decide what would confirm the trade, and define the exact price action that kills the idea.
Use this as a compact decision tool.
S-R Trading Cheat Sheet
| Market Condition | What Matters Most | Bullish Read | Bearish Read |
|---|---|---|---|
| Trending market | Dynamic support or resistance, plus structure | Pullback holds at a dynamic level and buyers defend the next higher low | Rally stalls at a dynamic level and sellers force the next lower high |
| Range market | Clear range boundaries and reaction quality | Sweep of range low followed by fast reclaim and acceptance back inside the range | Sweep of range high followed by rejection and acceptance back below |
| Breakout attempt | Follow-through after the first expansion | Price closes through the level and continues to hold above it | Price breaks down, then stays below the level instead of snapping back |
| High-volatility session | Confirmation speed and candle closes | Fast reclaim with real participation, not a thin wick | Sharp rejection that cannot recover on the next few candles |
| Crowded level everyone sees | Confluence and failed auction signals | Trap below support, then recovery back through the level | Trap above resistance, then failure back under the level |
Quick pre-trade filter:
- Start with the daily or 4H chart. Intraday levels work better when they align with higher timeframe structure.
- Mark where price was accepted, not just where a wick printed.
- In crypto, dynamic levels often matter more than static lines during trend days.
- If the level is obvious, expect a sweep before the subsequent move.
- Countertrend setups need tighter risk and better confirmation.
- Write the invalidation first. Entry comes second.
One more point matters in crypto more than it does in many other markets. A level can look clean at 2 p.m. and fail by midnight because this market never closes. That is why I treat support and resistance as an area of interest, then wait for behavior. If buyers or sellers do not defend the area with conviction, the line on the chart means very little.
Coiner Blog publishes practical crypto guides for readers tracking Bitcoin, Ethereum, altcoins, DeFi, NFTs, Web3, tokenomics, Layer 2 ecosystems, and newer themes like AI integration and real-world asset tokenization. If you want more market structure breakdowns, trading education, and plain-English analysis, explore the latest articles on Coiner Blog.